


Fair Isaac Corporation: Can Investors Bank on FICO’s Score?
Since 1990 until today Fair Isaac compounded its share price with a CAGR of 23.8%, 40% returns on capital, and cash flow CAGR of 19%. But, is it as good as it looks? Is there more to this story?

Hi, partner! 👋🏻
When you’re about to lease a new car, apply for a mortgage, lend cash for renovation, or any other type of lending, your credit score will be checked by the lenders. Fair Isaac Corporation gives the (in)famous 300 to 850 credit score. The FICO score is the most famous product lenders use worldwide to assess individuals' creditworthiness.
Low credit score? Sorry, but you might not be able to lease that new Hellcat you’ve been eyeing, renovate your kitchen, or not be able to lend the amount of cash you need for your mortgage.
FICO scores are the standard in the lending industry. They are used by major banks, credit card issuers, mortgage lenders, and other financial institutions.
So, when you’re not eligible for that new Hellcat, blame the FICO score you were given.
In addition, Fair Isaac offers products for risk management, collections optimization, and compliance for companies.
Fair Isaac Corporation has a monopoly, but does this mean it generates excellent shareholder returns? Let's examine its business to find out.
Thank you for being part of another investment case, and happy reading!
P.S. It would mean the world if you could restack this investment case! ❤️
If you’re interested in my previous investment cases, you can check them out here:
Table of contents
Corporate Analysis
1.1 Business Overview
1.2 Revenue BreakdownExecutive Leadership
2.1 CEO Experience
2.2 Employee Satisfaction Ratings
2.3 CEO Value CreationInsider and institutional ownership
Competitive and Sustainable Advantages (MOAT)
Industry Analysis
5.1 Industry Growth Prospects
5.2 Competitive LandscapeRisk Assessment
Financial Stability
7.1 Asset Evaluation
7.2 Liability AssessmentCapital Structure
8.1 Expense Analysis
8.2 Capital Efficiency ReviewProfitability Assessment
9.1 Profitability, Sustainability, and Margins
9.2 Cash Flow AnalysisGrowth Projections
Value Proposition
11.1 Dividend Analysis
11.2 Share Repurchase Programs
11.3 Debt Reduction StrategiesQuality Rating
Valuation Assessment
1. Corporate Analysis
1.1 Business Overview
By now, you know the drill: Do we understand the business and how it generates revenues? If we can answer this question, we have a solid grasp of the business.
Fair Isaac invented the Fair Isaac (FICO) score, which helps banks and lenders determine how risky it is to lend money to someone. This score predicts how likely you are to repay a loan on time. Moreover, they provide software that helps companies like banks, retailers, and insurers decide who to give a loan to, how to detect fraud, and which customers to target with special offers. In addition, Fair Isaac’s tools monitor transactions to spot unusual activity that might be fraud.
How does Fair Isaac generate its revenues?
Selling Credit Scores: Banks, credit card companies, and other lenders pay Fair Isaac to access credit scores. Every time a lender checks someone’s credit, Fair Isaac earns money.
Licensing Their Software: Fair Isaac sells software to businesses to help them automate decisions about loans, fraud detection, and customer management.
Recurring Subscriptions: Many businesses subscribe to Fair Isaac’s services, paying regular fees to use their tools and analytics.
Consulting and Custom Solutions: Fair Isaac works with companies to design custom solutions for their unique needs, such as a fraud detection system for a specific bank.
Simple example:
Imagine a bank wants to decide whether to give someone a credit card. They:
Pay Fair Isaac to check the person's credit score.
Use Fair Isaac’s software to predict how likely the person is to pay their bill.
Use Fair Isaac’s fraud detection tools to monitor for unusual spending.
Fair Isaac earns money at each step of this process.
Oké, now we have a solid grasp of what Fair Isaac is and how it generates its revenues. Now, let us go over their revenues!
1.2 Revenue Breakdown

Fair Isaac’s primary revenue drivers are:
Scores: This includes Business-to-Business Scores Revenue and Business-to-Consumer Scores revenue (accounts for roughly 55% of total revenue)
Professional Services: Encompasses analytics, digital decisioning technology, and associated services. (accounts for roughly 5% of total revenue)
On-Premises and Saas Software: This includes Platform Software Revenue and Non-Platform Software Revenue (accounts for roughly 40% of total revenue)
Fair Isaac has a solid portfolio of five diverse product offerings. Here they are summed up:
Platform Software (accounts for roughly 12% of total revenue)
Non-Platform Software (accounts for roughly 28% of total revenue)
Professional Services (accounts for roughly 5% of the total revenue)
Business-to-Business Scores (accounts for roughly 43% of the total revenue)
Business-to-consumer scores (accounts for roughly 12% of the total revenue)
Investors in any business should seek product diversification. There is diversification, and there is too much. However, Fair Isaac has a strong and manageable product portfolio. It offers solutions that fit multiple customer needs, so when customers take one service or product, they’re highly likely to take another, making the product offering extremely complementary. Later on we will see that Fair Isaac manages to up-sell other products to its customers.
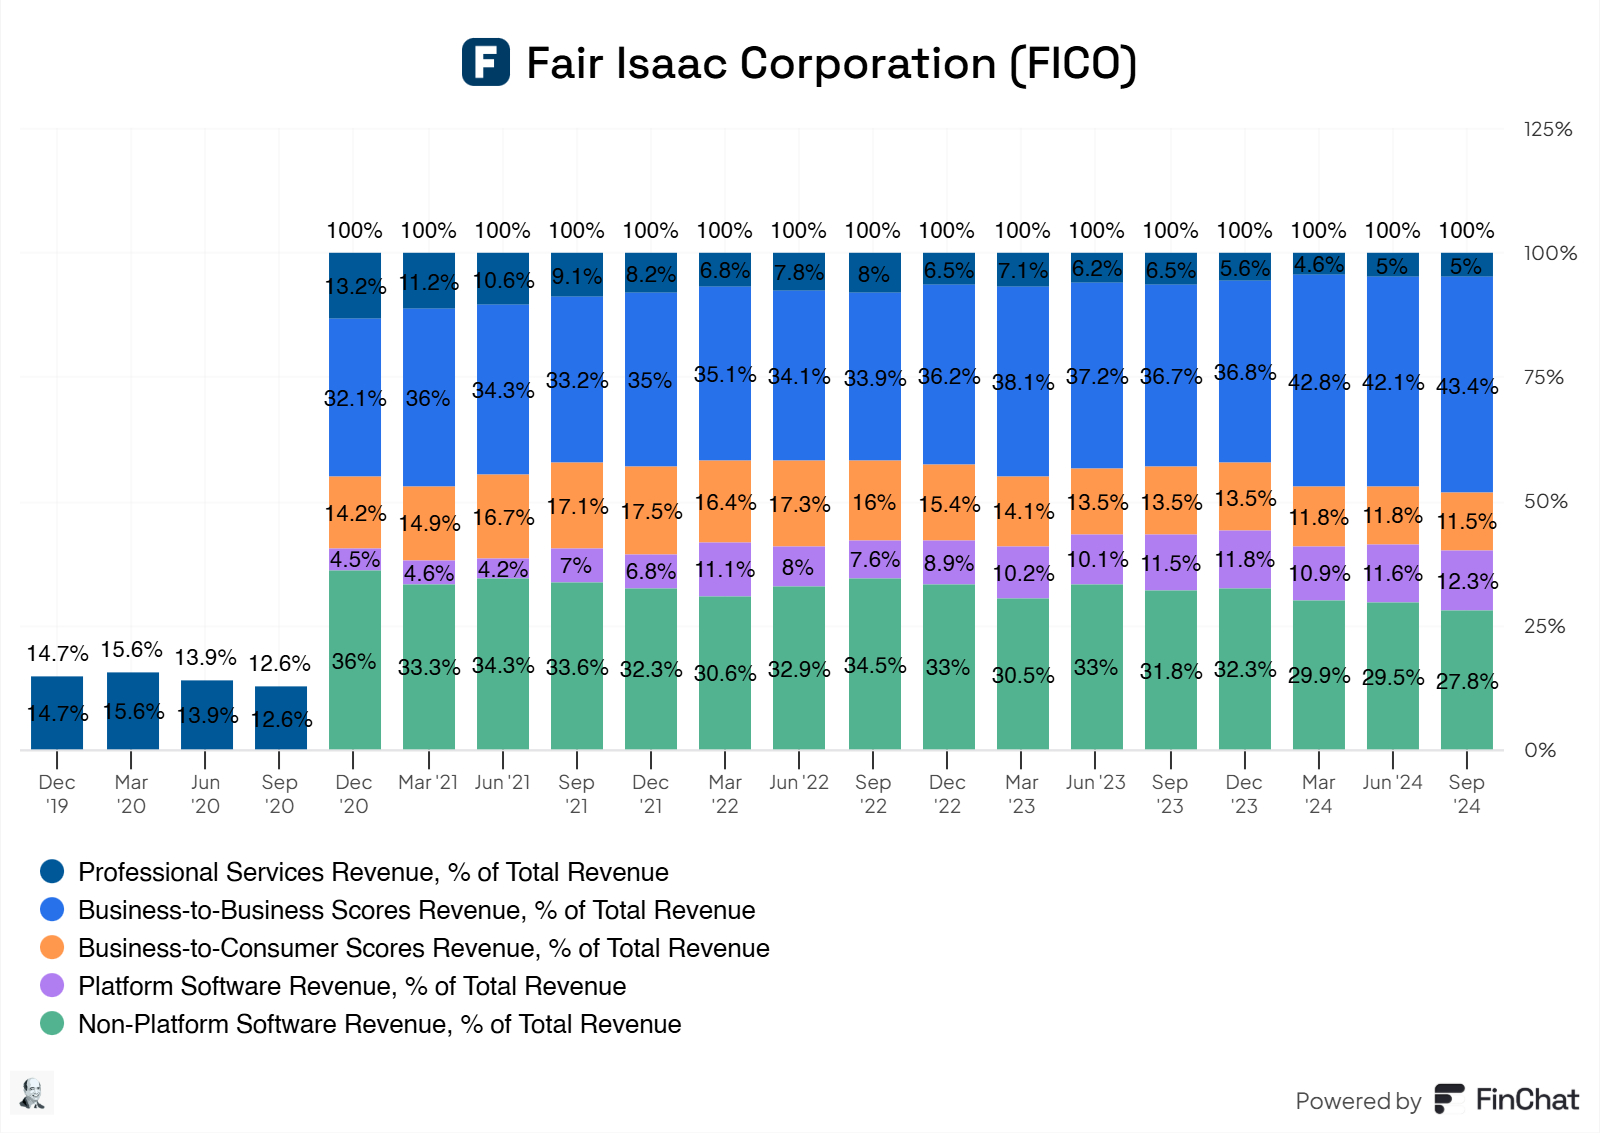
Overall, Fair Isaac has a well-balanced mix of product offerings. This bird's view demonstrates that Fair Isaac's product offerings have remained stable. The Platform Software segment is seeing significant growth, as is the Business-to-Business Score segment, but nothing out of the ordinary.
Before we move on to the CEO, there’s something we should look at with the software business: the ARR (Annual Recurring Revenue), DBNRR (Dollar-Based Net Retention Rate), and ACV Bookings (Annual Contrat Value Bookings). This shows us the true added value of their services/products and the customer satisfaction or churn.
Let us start with the ARR:
ARR = MRR (Monthly Recurring Revenue) x 12

The ARR for Platform and Non-Platform revenue shows that Platform ARR is steadily growing, and Non-Platform is also showing growth but is more modest. This is due to the Non-Platform being a lower-priority business line for Fair Isaac, suggesting maturity as well.
The Platform's percentage of total ARR increased from 23% (Dec 2022) to 31% (Sep 2024). This indicates a strategic shift towards Platform products, which now contribute more to total ARR. The Non-Platform percentage decreased from 77% to 69%, reflecting its relative decline in importance.
The Platform's year-over-year change shows rapid growth early on (46%—60% in 2023), but the growth rate slowed to 31% by September 2024. The non-platform's year-over-year change ranges from 3% to 14%, reflecting the mature business line.
Total ARR starts strong at 11%- 22% in 2023 but slows to 8%- 14% by 2024, as Non-Platform growth is limited and Platform growth stabilizes.
The primary focus is on Platform revenue, which is growing faster and contributing more to the total ARR over time. Non-platform ARR growth is minimal, indicating it is likely a legacy or less innovative part of the business. This is fine if it doesn't significantly lower the overall ARR.
Overall, ARR growth is slowing. The total YoY growth decreases from 22% in 2023 to 8%—14% in 2024, reflecting challenges in sustaining high growth as the business matures. This is normal, but we should watch for impairments in the overall ARR.
Now, over to the DBNRR side:
DBNRR = (Retained Recurring Revenue / Base Recurring Revenue) x 100
DNBRR tracks revenue growth (or loss) from existing customers over time. Values above 100% indicate expansion, while values below 100% indicate churn.
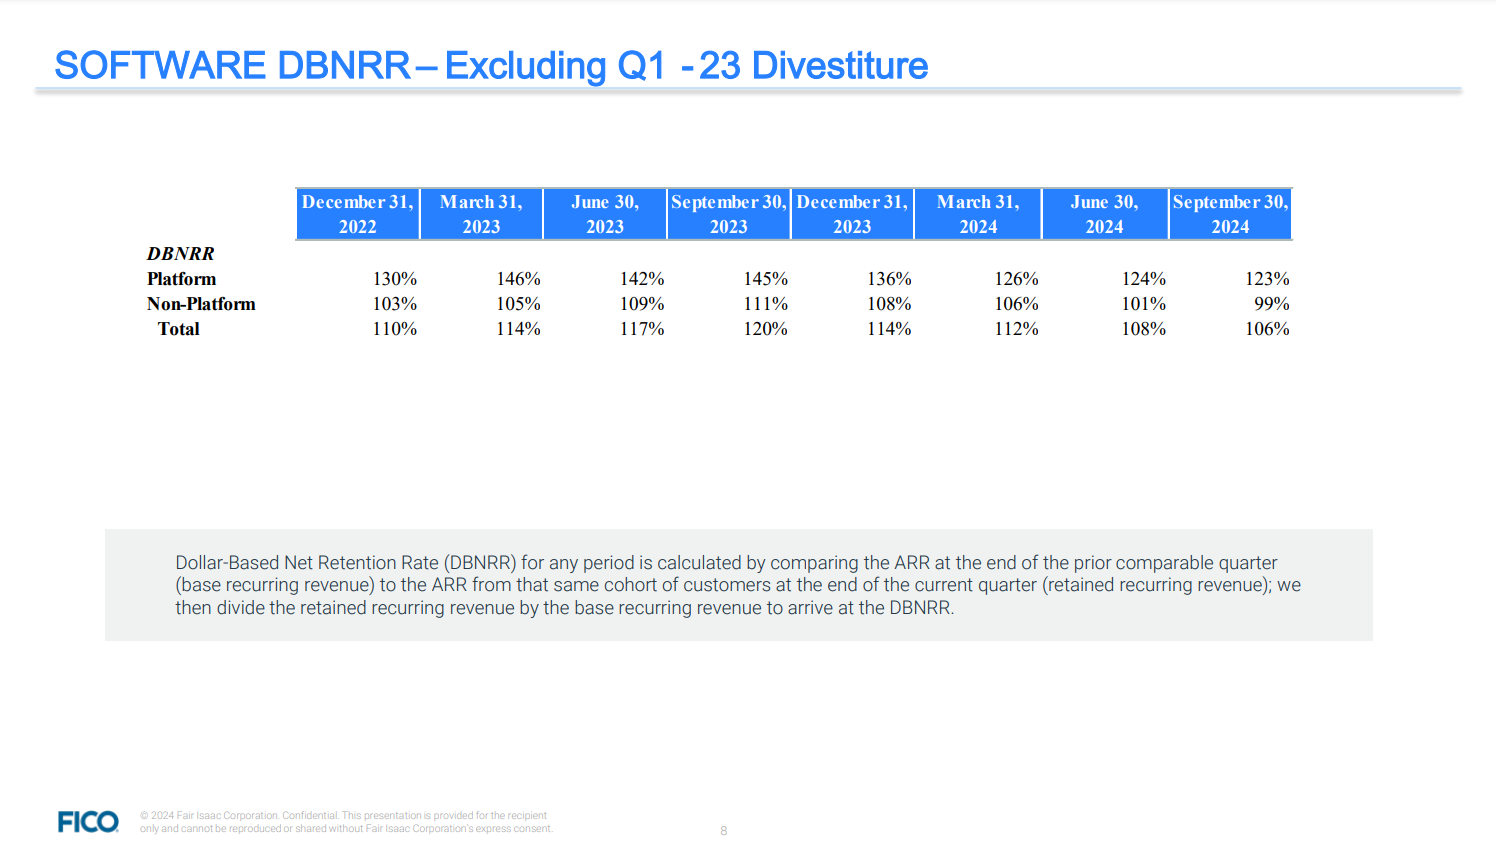
Platform DBNRR is consistently above 100%, peaking at 146% (March 2023) and gradually declining to 123% (September 2024). This means that customers are spending significantly more on Platform products compared to years prior, which is good! However, the retention rate is slowing down over time… This indicates the Platform successfully drives expansion revenue (e.g., upgrades and cross-sells), though the momentum is softening.
Non-Platform DBNRR hovers slightly above or below 100%, starting at 103% (December 2022) and declining to 99% (September 2024). The Non-Platform segment is losing some revenue over time, with more customers reducing or stopping their spending. This is likely because it is a legacy product line with less emphasis on growth. We saw this coming from the ARR part of this segment.
The overall DBNRR for the company starts at 110% (December 2022), peaks at 120% (September 2023), and then declines to 106% (September 2024). The company is still expanding revenue from its existing customers, but the growth rate is slowing. Platform products are the primary driver of the positive DBNRR, offsetting the weaker performance of Non-Platform products.
Market saturation and reduced expansion opportunities are slowing revenue from the Non-Platform segment. Is this worrying? If it continues, we should monitor it more closely. Fair Isaac’s Platform segment is driving growth and retaining customers well, while Non-Platform is losing momentum. The overall company DBNRR is positive but gradually decreasing, reflecting slowing expansion revenue from existing customers.
Now, over to the ACV Bookings:
ACV Bookings = Total Contract Value of New Contracts Signed in a Period / Contract Term in Years

ACV Bookings refer to the average annualized value of new software contracts signed in a given quarter.
Only contracts with a term of at least 24 months are included.
Excludes non-recurring revenues like perpetual licenses.
ACV Bookings peak in Q4-23 ($28M) and Q3-24 ($27.5M), suggesting possible seasonality or strong sales efforts in specific quarters. There’s a noticeable dip in Q1-24 and Q2-24, possibly indicating slower sales or fewer high-value contracts. While there are periods of strong contract signings, the decline in ACV Bookings in Q1-24 ($18.3M) and Q2-24 ($16.8M) may signal challenges in sustaining consistent growth momentum.
Now that we understand the different revenue segments, let’s review Fair Isaac’s management.
2. Executive Leadership
2.1 CEO Experience
William Lansing currently serves as the Chief Executive Officer of Fair Isaac. Before joining Fair Isaac, Mr. Lansing served as CEO and president of InfoSpace and as CEO and President of ValueVision Media. He was a partner at General Atlantic Partners, a global private equity firm. Before his work at General Atlantic, Mr. Lansing served as CEO of NBC Internet, an Internet media company, and as CEO of Fingerhut, a direct marketing company. He has also held leadership positions at General Electric, Prodigy, and McKinsey & Company. Mr. Lansing has served on the board of directors of Fair Isaac since February 2006. He also serves on the global board of advisors for Operation Hope and the board of directors of SafeGraph. He holds a B.A. from Wesleyan University and a J.D. from Georgetown University.
The most notable item here is the tenure of management. Now, let's review the tenure of the CEO.
Does the CEO have a solid tenure at the company? Yes, Will Lansing has been with Fair Isaac for 19 years.

2.2 Employee Satisfaction Ratings
Having a high score when it comes to your employee satisfaction levels is beneficial for a couple of reasons:
Boosts productivity
Reduces turnover costs
Enhances customer satisfaction
Encourages innovation
Builds a positive workplace culture
Increases profitability
Reduces absenteeism and burnout
Improves employer branding
Let us check what Fair Isaac’s employees think about the company.
Usually, I use Glassdoor, but there are limited reviews on Fair Isaac. Therefore, I switched to the beloved Indeed website. Here are the results.

This is based on 203 reviews from all levels within the business. Overall, Fair Isaac scores well here. Moreover, Fair Isaac was ranked number one on Forbes’ annual list of America’s Best Mid-Size Employers.
There are limited reviews, but the ones I find are generally positive!
2.3 CEO Value Creation
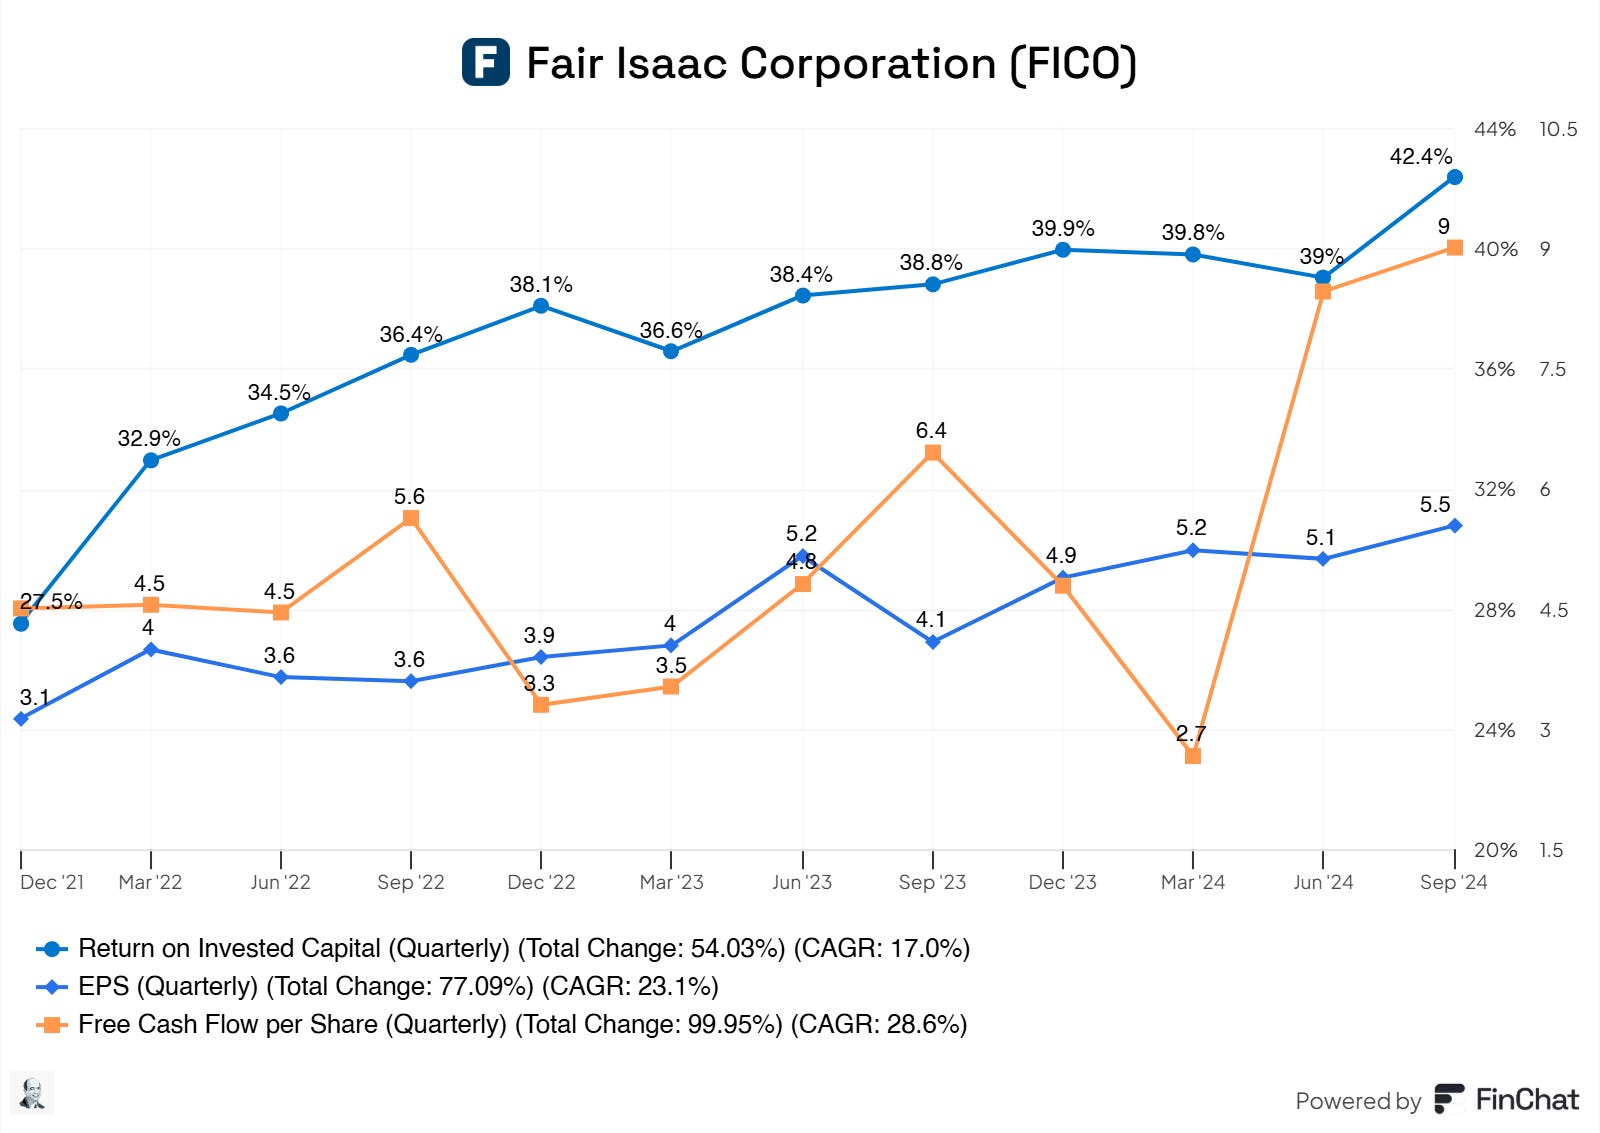
Will Lansing has been creating value for Fair Isaac and its shareholders, driving excellent total shareholder returns per share. Moreover, the investment that Fair Isaac is making is paying off well! Return on Invested Capital is growing YoY, indicating that management is allocating capital to the right projects.
3. Insider and institutional ownership
What does inside ownership look like? Let’s dive in!
William J. Lansing owns roughly 373.8K shares, worth 752.7M. His net worth is roughly $894M. This indicates that William J. Lansing has significant skin in the game! If he makes a mistake, he will feel the burden of this mistake in his own pockets. I favor companies where the CEO’s wealth is primarily locked in his ownership of his business.
A baker should eat his own cake. If he doesn’t, there’s something wrong with the cake or the baker.
His salary (cash) is roughly 1.1% of his total pay, 73% of which is the stock award value and 23% of which is the option award value. This should encourage William J. Lansing to align more with its shareholders, which is a good sign!
The only downside is that the Members of the Board do not have significant skin in the game… These people are in the company to be the voice of the investors, so to speak. If they also have significant skin in the game, you can almost be confident that their interest aligns with its shareholders. Now, board members do not have most of their wealth locked in via stocks or options, which raises my eyebrow. They have a comfortable salary, and if they pass something that negatively affects the business, they do not feel it in their pockets. I noticed and do keep this in mind, and so should you. Is it a direct killer for the business and its shareholders? No, of course not. However, we need all management members to be aligned with its shareholders.

Overall, insiders own 2.78% of the outstanding shares, which is good! We should aim for something above 2% or 3%.
So, are insiders buying stock?
No, they’re not…

Since February 2023, insiders have primarily been selling.
S - Sale: Sale of securities on an exchange or to another person
Sale+OE: Sale of securities on an exchange or to another person (after option exercise)
Now, there are plenty of reasons for selling. Think about tax reasons, financing reasons, etc. So, this should not be a sign that there’s no trust in this company, but we ideally would love to see insider scaling their positions. Insiders solely buy for one reason.
4. Competitive and Sustainable Advantage (MOAT)
So, a MOAT can be in either one or more of the following forms:
Brand Power
Patents
Scale and Cost Advantages
Switching Costs
Network Effect
Attracting Talent (I consider this a MOAT, others don’t. Decide for yourself)
Brand Power
Fair Isaac undoubtedly has a competitive advantage when it comes to their brand power. The FICO Score is synonymous with credit scoring. It’s the most widely used credit scoring system in the world, relied upon by:
90% of top lenders in the United States.
Banks, credit card issuers, auto lenders, and mortgage companies globally.
The FICO Score is a trusted benchmark for assessing creditworthiness for consumers and businesses.
Their long-standing history and expertise have built a reputation for reliability and accuracy, strengthening their brand recognition. Lenders and businesses have trusted Fair Isaac’s models to make critical decisions for decades. Consumers also view FICO Scores as a key indicator of financial health, adding to the brand's credibility.
Fair Isaac’s services are used worldwide, particularly in markets where credit scoring and risk assessment are critical to lending and decision-making.
Patents
I must disappoint you here; Fair Isaac has no competitive advantage. They do not rely on patents.
Scale and Cost Advantages
Here, Fair Isaac has a significant competitive advantage! Fair Isaac benefits from its large-scale operations, strengthening its market position and operational efficiency.
As more lenders rely on FICO Scores, the brand becomes the de facto standard for credit assessment, making it harder for competitors to challenge its dominance. Consumers, lenders, and businesses are interconnected by relying on FICO Scores. Decades of data collection and modeling have enabled Fair Isaac to create highly accurate and reliable scoring algorithms. The more data Fair Isaac processes, the better its models become, which is a self-reinforcing advantage.
The cost of developing and maintaining its scoring systems and software solutions is high initially but diminishes over time as it serves a growing number of customers. For example, once a scoring algorithm is developed, it can be deployed to thousands of lenders with minimal incremental cost. With an established infrastructure, Fair Isaac can deliver services to clients at a relatively low per-customer cost.
New entrants must invest heavily to match Fair Isaac’s scale, data resources, and reputation, making competing extremely challenging.
Switching Costs
Again, Fair Isaac has an incredible competitive advantage.
Fair Isaac’s credit scoring and analytics tools deeply integrate into financial institutions' decision-making processes, such as loan approval systems, risk management models, and fraud detection workflows. Switching to a competitor would require re-engineering these systems, which is expensive, time-consuming, and risky. Employees at these institutions are trained to use FICO’s tools and software. Adopting a new system would involve retraining staff, which adds costs and disrupts operations.
FICO Scores are the industry standard for assessing credit risk. Most banks and lenders use FICO Scores to evaluate borrowers, and consumers understand them as a key indicator of creditworthiness. Switching to a competitor’s scoring system might result in inconsistency or reduced trust among customers and stakeholders.
Fair Isaac’s scoring models and analytics tools often align with regulatory risk assessment and reporting requirements. Switching to a new provider would require significant effort to ensure compliance, which can be costly and complex.
Many customers sign multi-year agreements for Fair Isaac’s tools and software, creating a contractual switching cost. Breaking these contracts early often incurs penalties or fees, adding to the overall cost of switching.
Network Effect
Ding, ding, ding, we have another competitive advantage for Fair Isaac!
FICO Scores are used by 90% of top U.S. lenders and many international institutions to assess creditworthiness. The more lenders rely on FICO Scores, the more entrenched they become as the default standard in the financial industry. Consumers understand and trust FICO Scores, making them hesitant to rely on alternative scoring systems.
Borrowers actively monitor and improve their FICO Scores because they know lenders use them. Credit repair services, personal finance apps, and credit monitoring tools often focus specifically on FICO Scores. Borrowers know lenders rely on Fair Isaac, and lenders know borrowers are incentivized to optimize their FICO Scores. This mutual understanding strengthens the network’s value.
Attracting Talent
50/50 on this one, here’s why.
Fair Isaac is a globally recognized leader in credit scoring and analytics. Being associated with a company that sets the industry standard is attractive to professionals seeking prestige. But, this is not the sexy tech company many developers seek with massive pay and bonuses.
Fair Isaac is now into AI, machine learning, and big data analytics, which could drive top talent to the business.
I’m 50/50 on this one.
5. Industry Analysis
5.1 Industry Growth Prospects
The CRA (credit rating) and PADM (predictive analytics and decision management) industries are the most important for determining Fair Isaac's runway. Let us summarize the industry growth prospects!
Here, I will reference Market Research Future and Grand View Research research.
CRA Market Size and Growth Rate
The global credit scoring market is expected to grow from USD 10.29B in 2025 to USD 46.22B by 2034, reflecting a CAGR of 18.16%.
This rapid growth is fueled by the increasing number of credit applications globally, particularly in emerging markets, and the need for efficient, automated credit risk assessment tools.
Key Trends Shaping the Market
AI and Machine Learning Integration: AI-powered scoring models are improving the accuracy and efficiency of credit assessments, enabling lenders to evaluate borrowers more comprehensively.
Machine learning-based models are projected to grow at a CAGR of 22.1% by 2032, surpassing traditional statistical models in market share.
Alternative Data Sources
Using non-traditional data like social media activity, transaction data, and telco data is expanding credit access, especially for underserved populations.
Digital Banking and Real-Time Scoring
The rise of digital lending platforms drives demand for automated, real-time credit scoring systems.
End-User Insights
Banking (45% market share in 2023): Banks remain the dominant users of credit scoring solutions, leveraging them for loan approvals and risk management.
Emerging Markets: Regions like Asia-Pacific and Latin America are expected to grow significantly as financial inclusion and digital transformation accelerate.
Impact on Fair Isaac: Fair Isaac is well-positioned to benefit from these trends due to its leadership in credit scoring solutions, deep expertise in analytics, and ability to innovate with AI-powered models. Its reliance on traditional and alternative data sources further enhances its competitive edge.
PADM Market Size and Growth Rate
The predictive analytics market is projected to grow from USD 18.89B in 2024 to USD 82.35B by 2030, with a robust CAGR of 28.3%.
The surge in demand is driven by the exponential growth of data, advancements in AI and machine learning, and the increasing need for real-time decision-making.
Key Trends Shaping the Market
AI and Big Data: Predictive analytics tools increasingly leverage AI and big data to uncover patterns and provide actionable insights, improving operational efficiency across industries.
Cloud Adoption: Cloud-based predictive analytics solutions are growing at the fastest rate due to their scalability, cost-effectiveness, and real-time processing capabilities.
Demand for Personalization: Retail, BFSI, and healthcare sectors are adopting predictive analytics to personalize customer experiences and improve decision-making.
End-Use Insights
BFSI (Dominant Segment): Predictive analytics is extensively used for fraud detection, risk management, and credit risk assessment in the financial sector.
As BFSI undergoes digital transformation, Fair Isaac’s predictive analytics tools will become increasingly indispensable.
Retail and E-commerce (High CAGR): Retailers are using predictive models to optimize inventory, enhance customer engagement, and tailor marketing strategies.
Impact on Fair Isaac: Fair Isaac’s investments in AI and machine learning align perfectly with the explosive growth of predictive analytics. Its decision management platforms and fraud detection tools are increasingly valuable to BFSI and retail, where the need for advanced analytics is critical.
Fair Isaac benefits from operating in high-growth markets. As a core business, credit scoring provides stability and recurring revenue. The predictive analytics market offers growth opportunities through AI-driven solutions and cloud adoption. Fair Isaac can maintain its leadership position and capitalize on emerging trends by integrating AI, machine learning, and alternative data sources. Growth in emerging markets (Asia-Pacific, Latin America) provides untapped opportunities for Fair Isaac’s credit scoring and analytics solutions.
Fair Isaac is at the forefront of two dynamic industries undergoing rapid transformation. The projected growth rates—18.16% CAGR in credit scoring and 28.3% CAGR in predictive analytics—highlight immense opportunities for innovation, market penetration, and revenue growth. Fair Isaac is well-equipped to thrive in these expanding markets with its established brand power, strong market position, and ongoing technological advancements.
Little bonus: Fair Isaac Corporation dominates the U.S. credit scoring industry. Its Fair Isaac Score is the standard measure of consumer credit risk, and the company maintains a near-monopoly market share in this sector.
5.2 Competitive Landscape

I identify the following companies as peers or competitors of Fair Isaac for their primary segment, the credit segment.
S&P Global
Moody’s
Experian plc
Equifax
TransUnion
Let’s go over their metrics and compare these with Fair Isaac!
Operating Margin: 42.7%
Fair Isaac Corporation leads its peers with an operating margin of 42.7%, reflecting exceptional operational efficiency and cost control. This outpaces competitors like Experian (EXPN, 24.8%) and Equifax (EFX, 18.5%) while slightly surpassing Moody’s (MCO, 42.0%).
Gross Profit Margin: 79.7%
Fair Isaac dominates with a gross profit margin of 79.7%, demonstrating its strong pricing power and efficient cost management. This is far ahead of Experian (40.7%), Equifax (55.5%), and even Moody’s (72.9%), making it the clear leader in this category.
Return on Invested Capital (ROIC): 41.0%
Fair Isaac showcases exceptional capital efficiency with an ROIC of 41.0%, well above peers such as S&P Global (SPGI, 7.0%), Equifax (7.0%), and Experian (12.8%). This performance underscores Fair Isaac's ability to generate superior returns on invested capital.
Free Cash Flow (FCF) Margin: 36.3%
With an FCF margin of 36.3%, Fair Isaac outperforms competitors, including Moody’s (33.7%) and S&P Global (37.4%). Its robust cash-generating ability positions it as a leader in financial stability and flexibility.
Free Cash Flow Per Share: $24.88
FICO leads in free cash flow per share with $24.88, far surpassing Experian ($1.92) and Equifax ($6.27). This reflects its strong ability to generate shareholder value.
EBITDA Margin: 43.5%
FICO has a substantial EBITDA margin of 43.5%, although it trails S&P Global (48.3%) and Moody’s (48.1%) slightly. However, it remains well ahead of Experian (30.2%) and Equifax (30.4%).
Revenue Growth (5-Year CAGR): 8.2%
FICO’s revenue growth of 8.2% is steady but lags behind S&P Global (16.2%) and Equifax (10.2%). However, it is comparable to Moody’s (8.2%) and Experian (7.9%), reflecting a slower expansion than its peers.
FICO excels in profitability metrics such as operating margin, gross profit margin, and ROIC, showcasing its operational and financial efficiency dominance. Its free cash flow generation is also unmatched, with the highest FCF per share among peers. However, FICO trails slightly in revenue growth and EBITDA margin, whereas competitors like S&P Global and Moody’s have a slight edge. FICO demonstrates its profitability and capital efficiency strength, solidifying its industry leadership.
6. Risk Assessment
Competition from Credit Bureaus and Alternative Scoring Models
The rise of alternative credit scoring models (e.g., VantageScore) and increased regulatory scrutiny could impact demand for FICO’s scoring solutions.
Dependence on Key Products & Services
A substantial portion of FICO’s revenue comes from scoring solutions, fraud solutions, and decision management software. If market acceptance declines for these, revenues could drop.
Data Access and Third-Party Dependence
FICO relies on proprietary databases and external data sources for model construction. If data providers restrict access due to privacy concerns or regulatory changes, FICO's ability to maintain and improve its models could be impacted.
Increased Regulatory Scrutiny on Credit Scoring Fees
U.S. regulators, including the CFPB, are investigating credit report fees, including fees for FICO scores in mortgage origination. New regulations could limit pricing power and reduce profitability
Acquisition & Integration Risks
FICO has expanded via acquisitions, but integrating new businesses successfully remains a risk. Poor acquisitions could dilute shareholder value or create operational inefficiencies
7. Financial Health
7.1 Assets Assessment
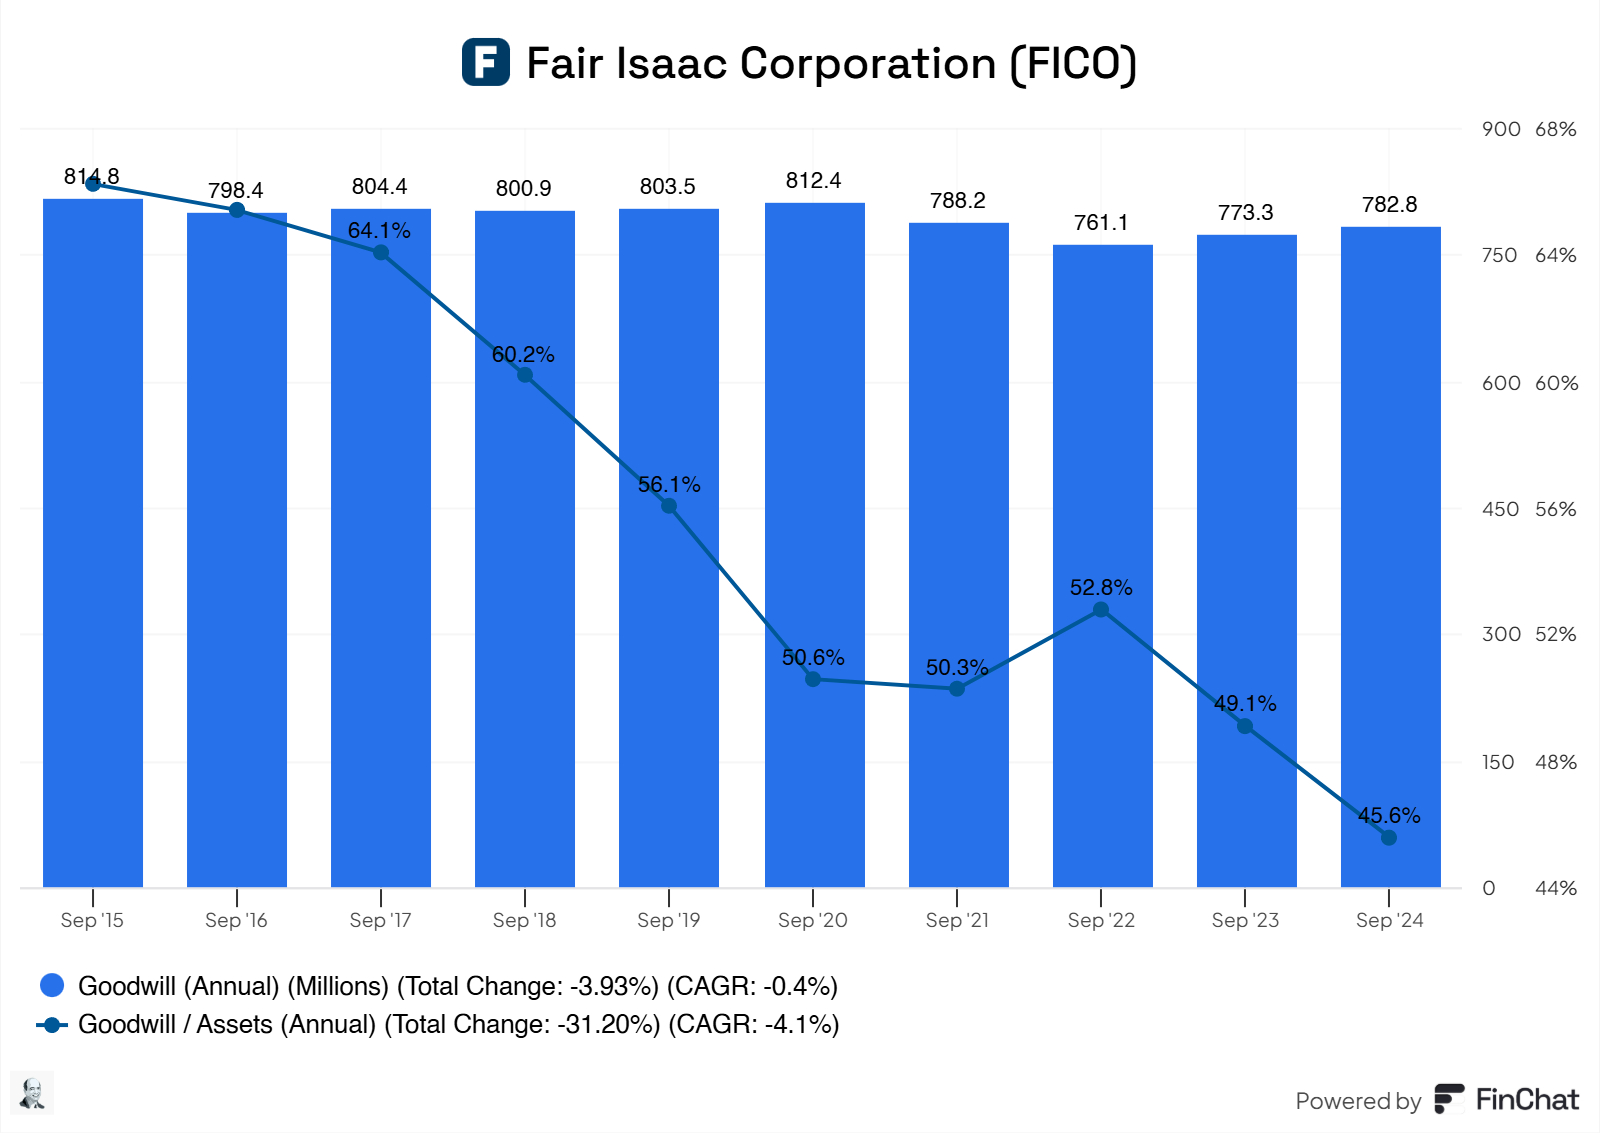
FICO has significant goodwill on the balance sheet, which is too much for me. FICO has made some significant acquisitions, driving up the Goodwill for the business. FICO has been paying high premiums for these acquisitions.
Moreover, FICO operates in industries like credit scoring and predictive analytics, which rely heavily on intangible assets rather than physical assets like factories or inventory. Key intangibles include:
FICO Scores: The proprietary algorithms behind FICO Scores.
Software Solutions: Decision management platforms and analytics tools.
Brand Value: FICO’s reputation as the industry standard in credit scoring.
These intangibles are not directly recorded on the balance sheet (apart from acquisitions), so goodwill becomes a significant portion of total assets when acquiring businesses.
FICO’s operations are asset-light, relying primarily on software, data, and intellectual property rather than physical assets. Its primary expenses are R&D and cloud/software infrastructure, not tangible items like equipment or buildings. As a result, its balance sheet shows relatively fewer tangible assets, which makes goodwill (from acquisitions) a more significant proportion of total assets.
Besides this note, there is nothing on Fico's asset side that we should worry about or watch out for.
7.2 Liabilities Assessment
Here, one issue immediately pops out: the heavily increasing long-term debt that Fico is taking on. This results in a negative equity position for Fico, with their Debt/Equity being -2.3 and their EBIT covering only 6.9 times their interest, which isn’t much. Fico is increasing their debt, and the interest that must be paid on these debts increases as well, making its debt position weaker. We ideally want to see a company be able to cover their interest 15x with their EBIT. The weighted average interest rate on this debt is 5.2%. 59% of its total debt is fixed rates; the remaining is floating.
According to their latest earnings call, management plans to use free cash flow to reduce outstanding floating rate debt balances, which is good. Ideally, these floating rate debts should be eliminated as quickly as possible, especially when the current cover rates of their interest are relatively low.
Currently, Fico has $2.680,6M in liabilities, most of which, $2.194,0M, are in long-term debts. Their total assets are $1.717,9M, creating negative equity for Fico. However, much of this comes from Fico’s relatively high Goodwill. Any subsequent impairment reduces equity by reducing retained earnings. When first reported, equity might indirectly appear firmer because of increased assets.
Something to keep an eye out for!
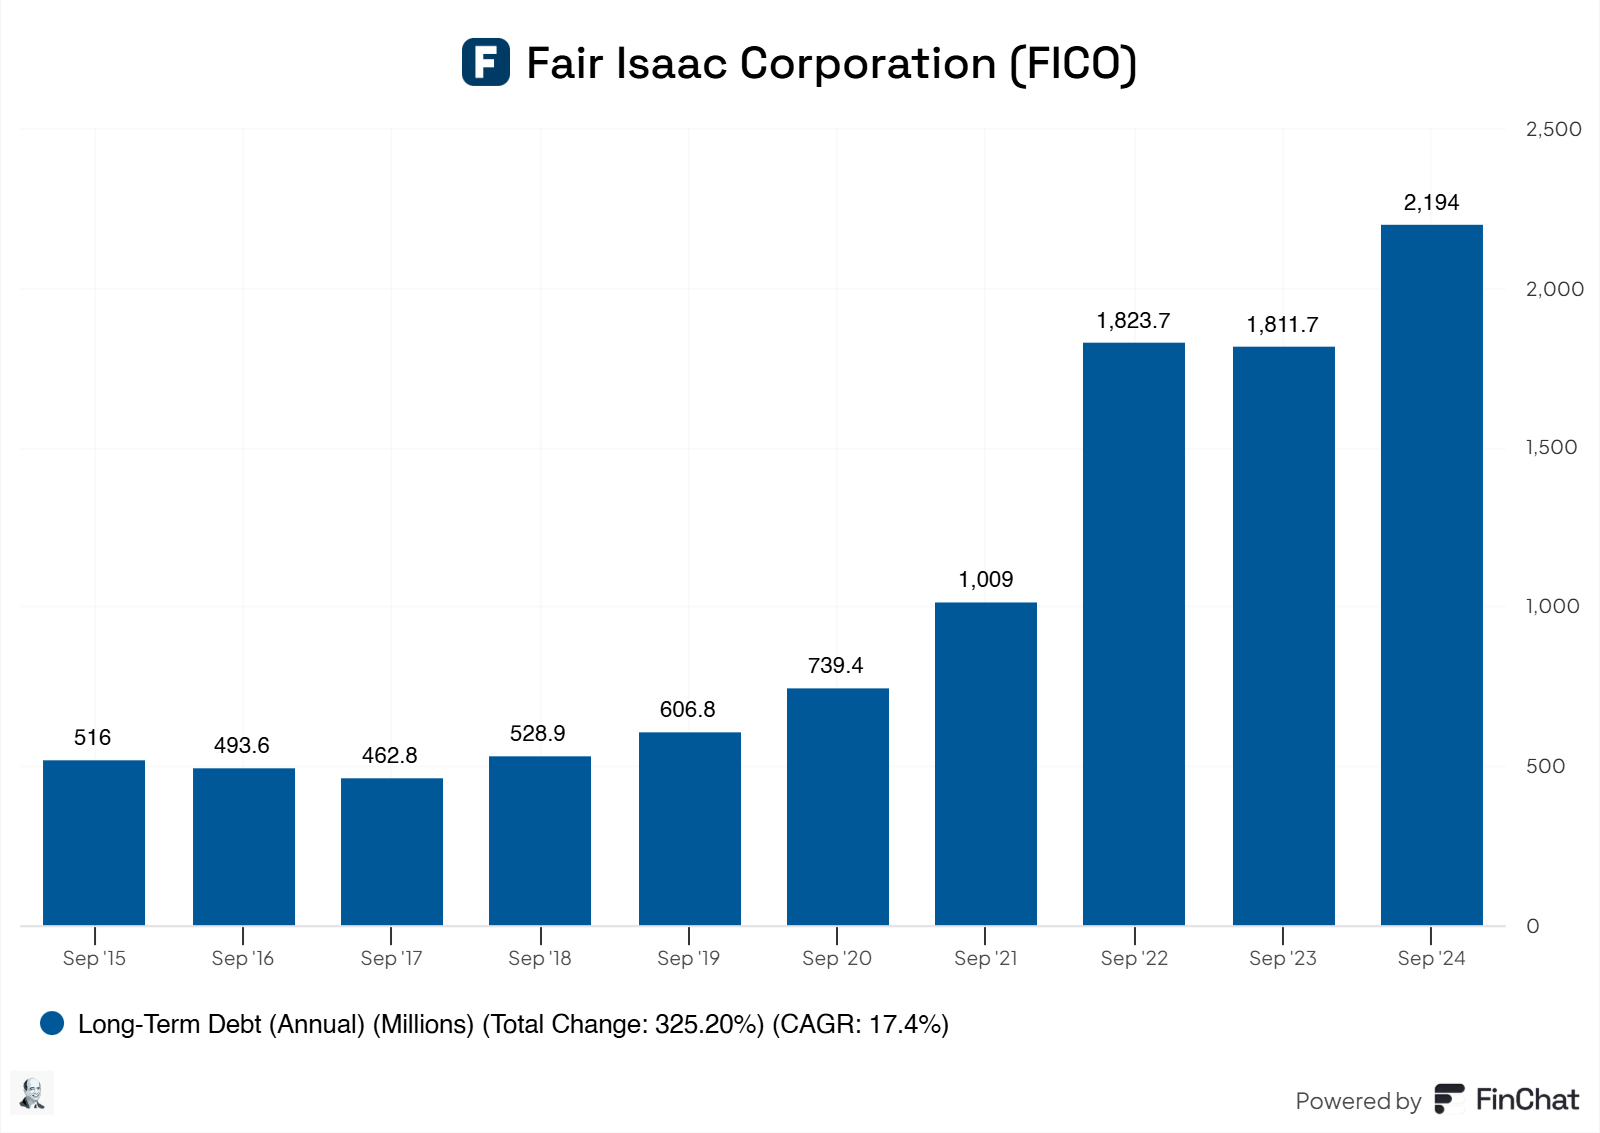
Other than this, there’s nothing we should watch for. However, we should monitor Fico’s long-term debt and non-fixed debt!
8. Capital Structure
8.1 Expense Analysis
Let us look at COGS, SG&A, R&D, and CapEx expenses!
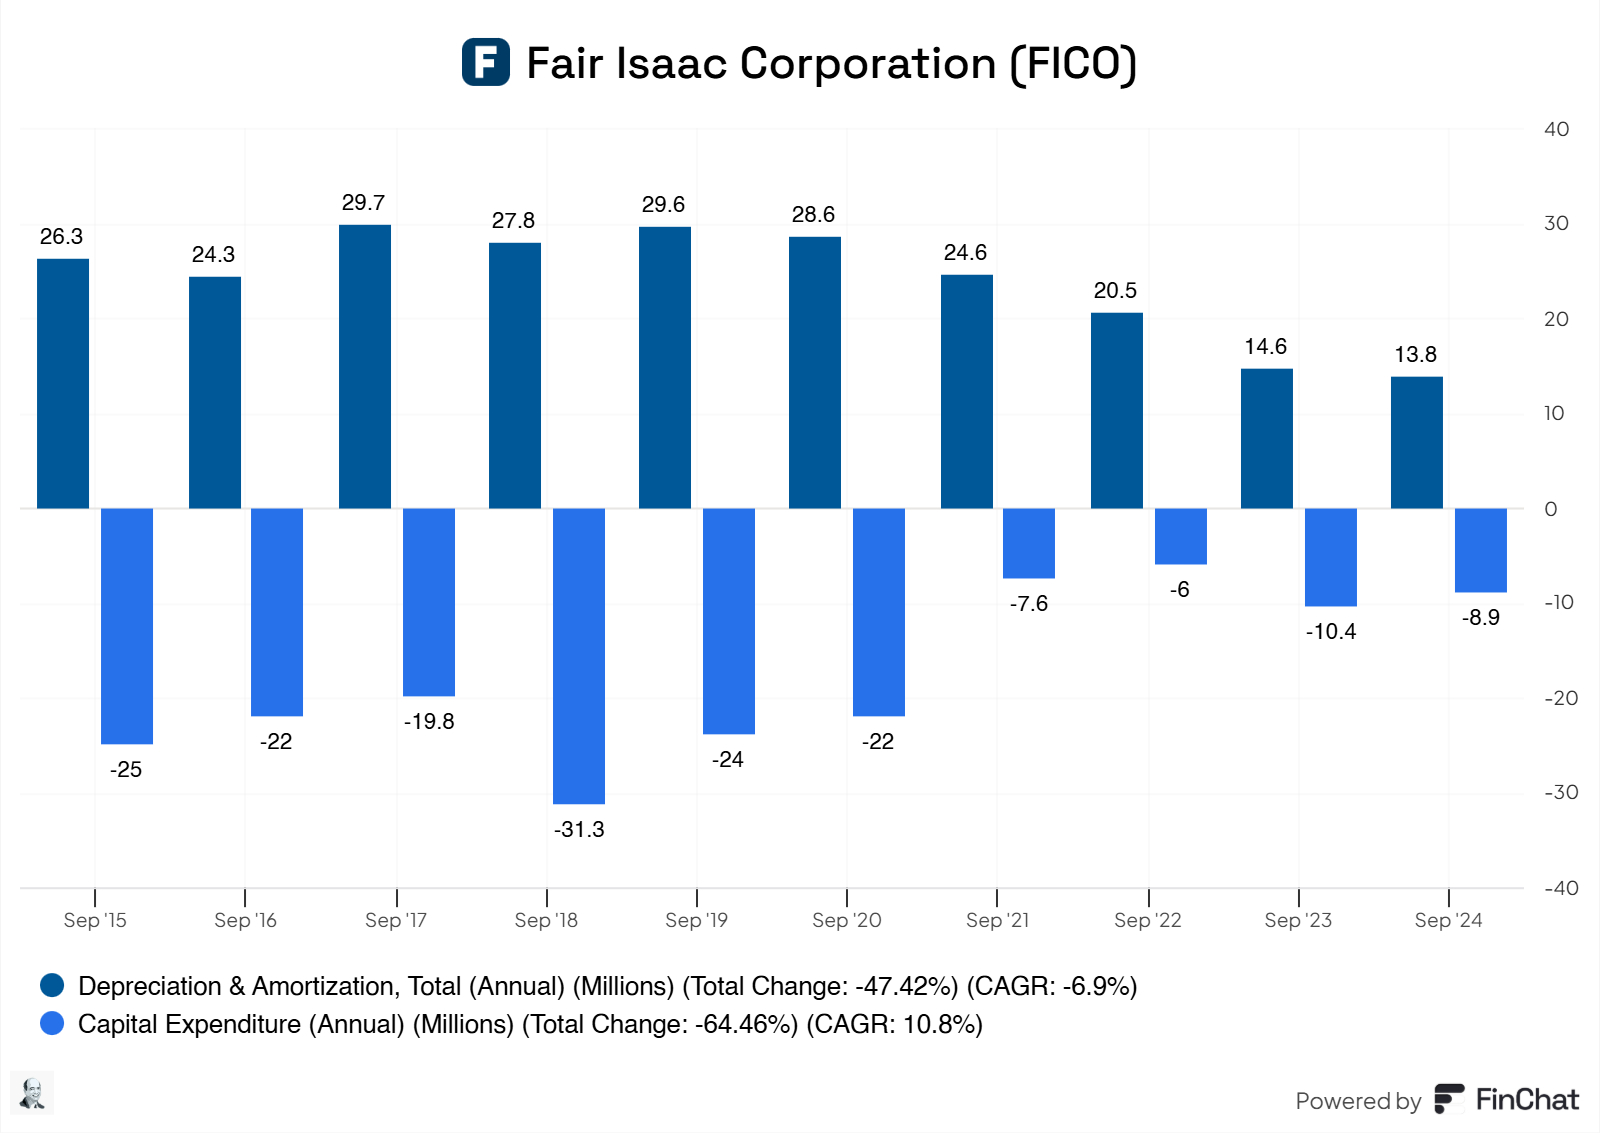
FICO operates in the software and analytics industry, which tends to be asset-light. These businesses rely more on intangible assets like intellectual property, software, and licenses than heavy machinery or physical infrastructure. As a result, the ongoing investment in physical assets (capex) is relatively low compared to the amortization of intangible assets or the depreciation of past investments.
Since capex is consistently below D&A, this indicates that FICO is not heavily reinvesting in physical or tangible assets. This is not necessarily a concern for a software/analytics company, as much of the spending might go toward operating expenses like R&D, marketing, or product development, which aren't reflected in capex.
Lower capex relative to D&A means that FICO generates significant free cash flow, as less cash is spent maintaining or growing fixed assets. When D&A > capex, "growth capex" (capex - D&A) will often turn negative. However, for a company like FICO, this does not imply shrinking operations but instead reflects a shift from capital-intensive growth toward more efficient, intangible-driven growth. The downward trend in D&A and capex (as shown in the chart) suggests that FICO has become increasingly efficient in asset utilization over time.
Overall, there is limited CapEx, which doesn’t surprise me due to the nature of the business.
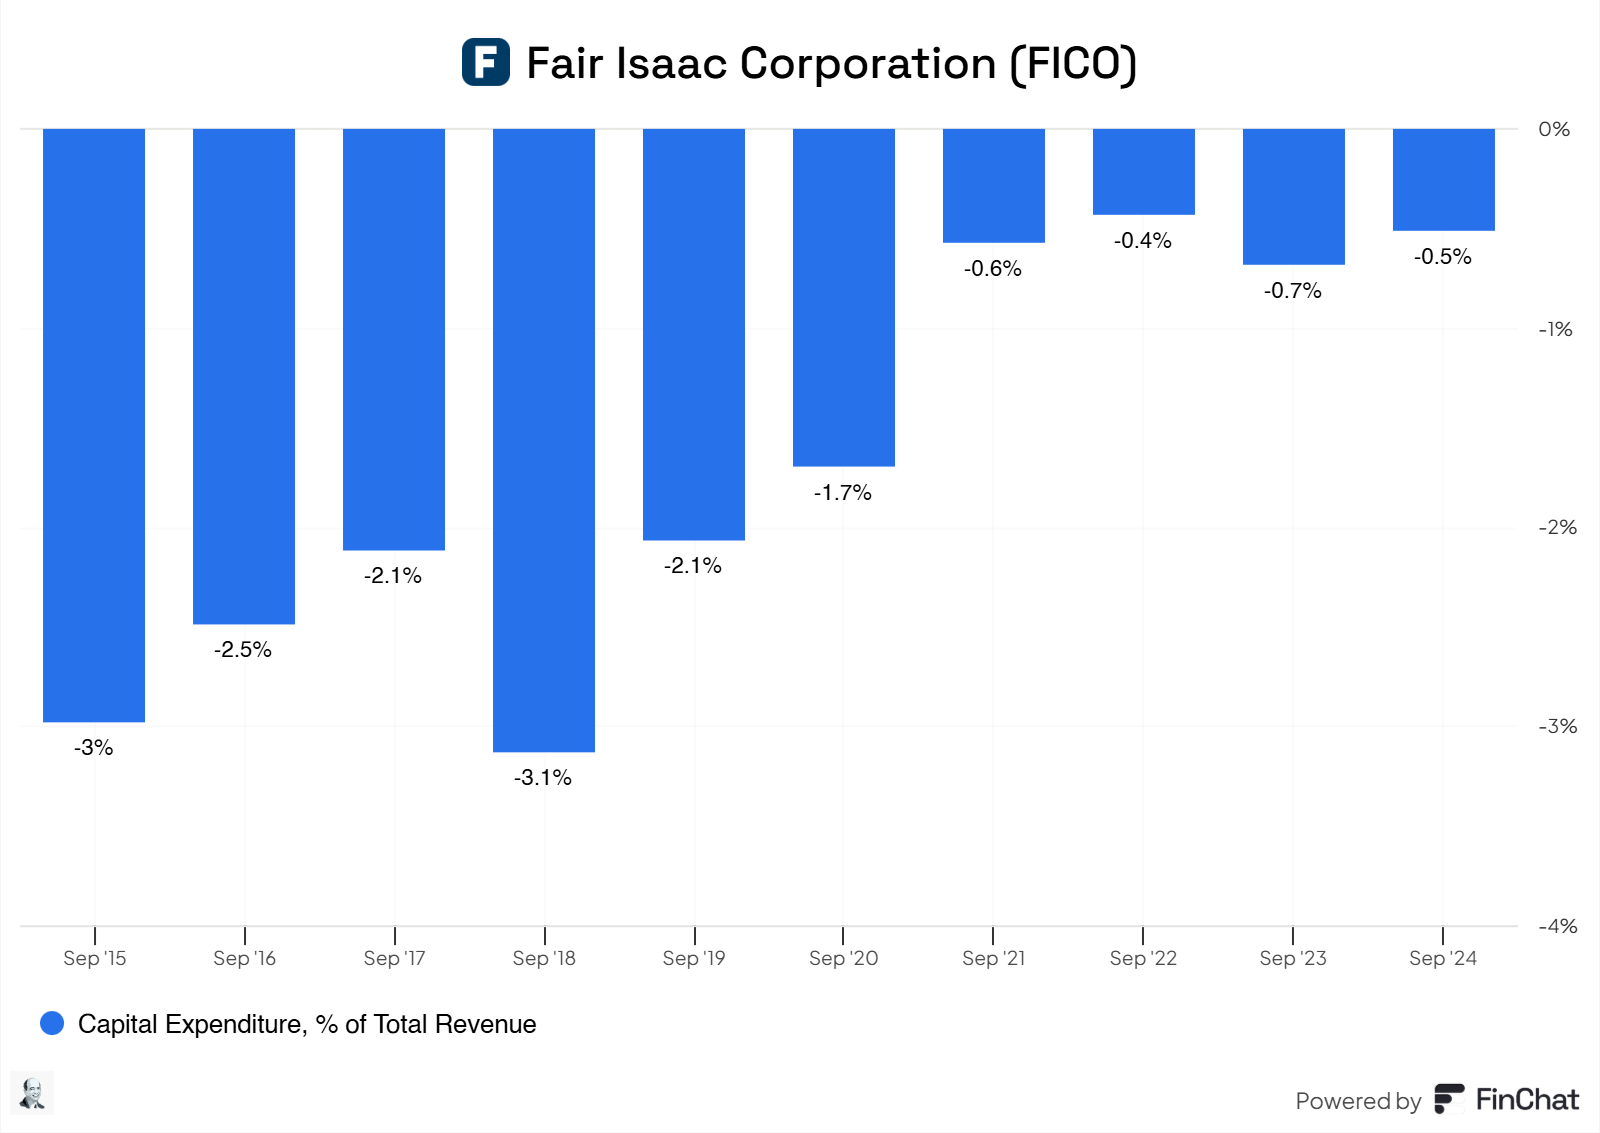
As shown here, Fico went from 3% CapEx-to-Sales to a mere 0.5% CapEx-to-Sales.
Now, let us go over COGS.
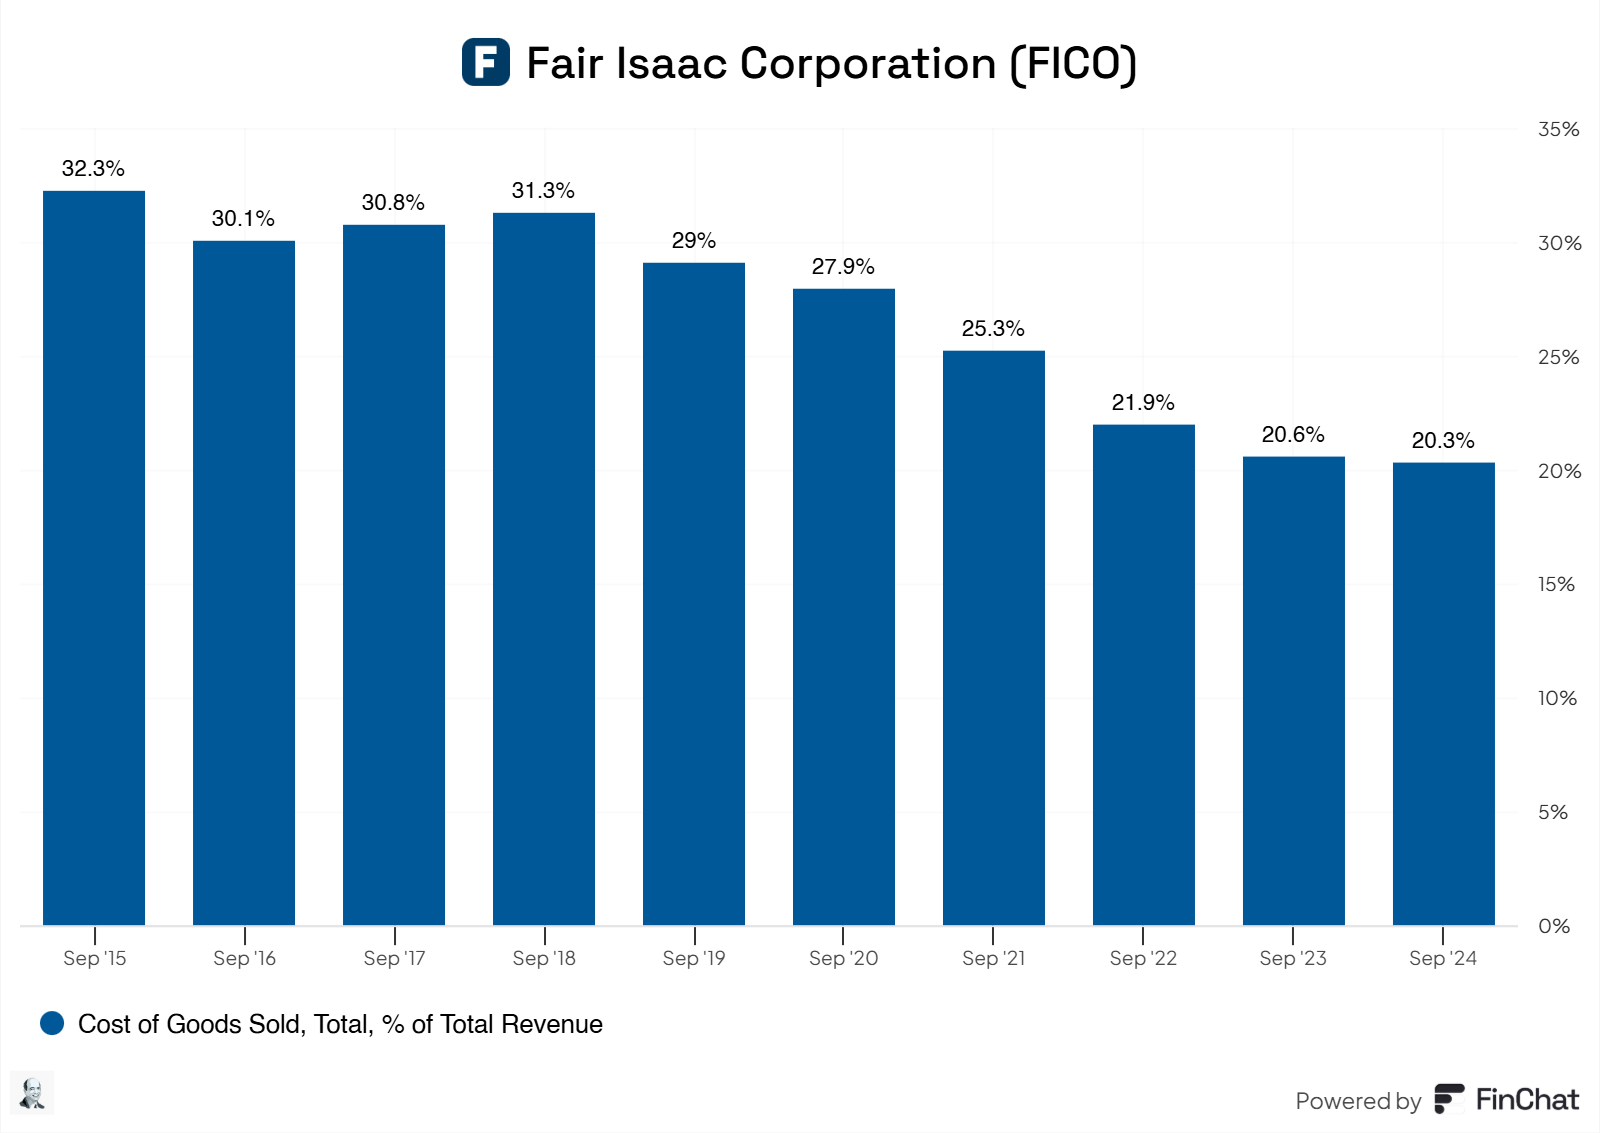
Here, we can see that Fico is spending less on producing or acquiring services relative to its sales. This, in return, implies higher gross margins for Fico. This decrease comes from lower production costs, better economies of scale, and overall more streamlined processes for Fico. Moreover, Fico probably commands higher prices without increasing their costs significantly, which is not rare for software businesses, of course.
The same can be found in Fico’s SG&A costs.
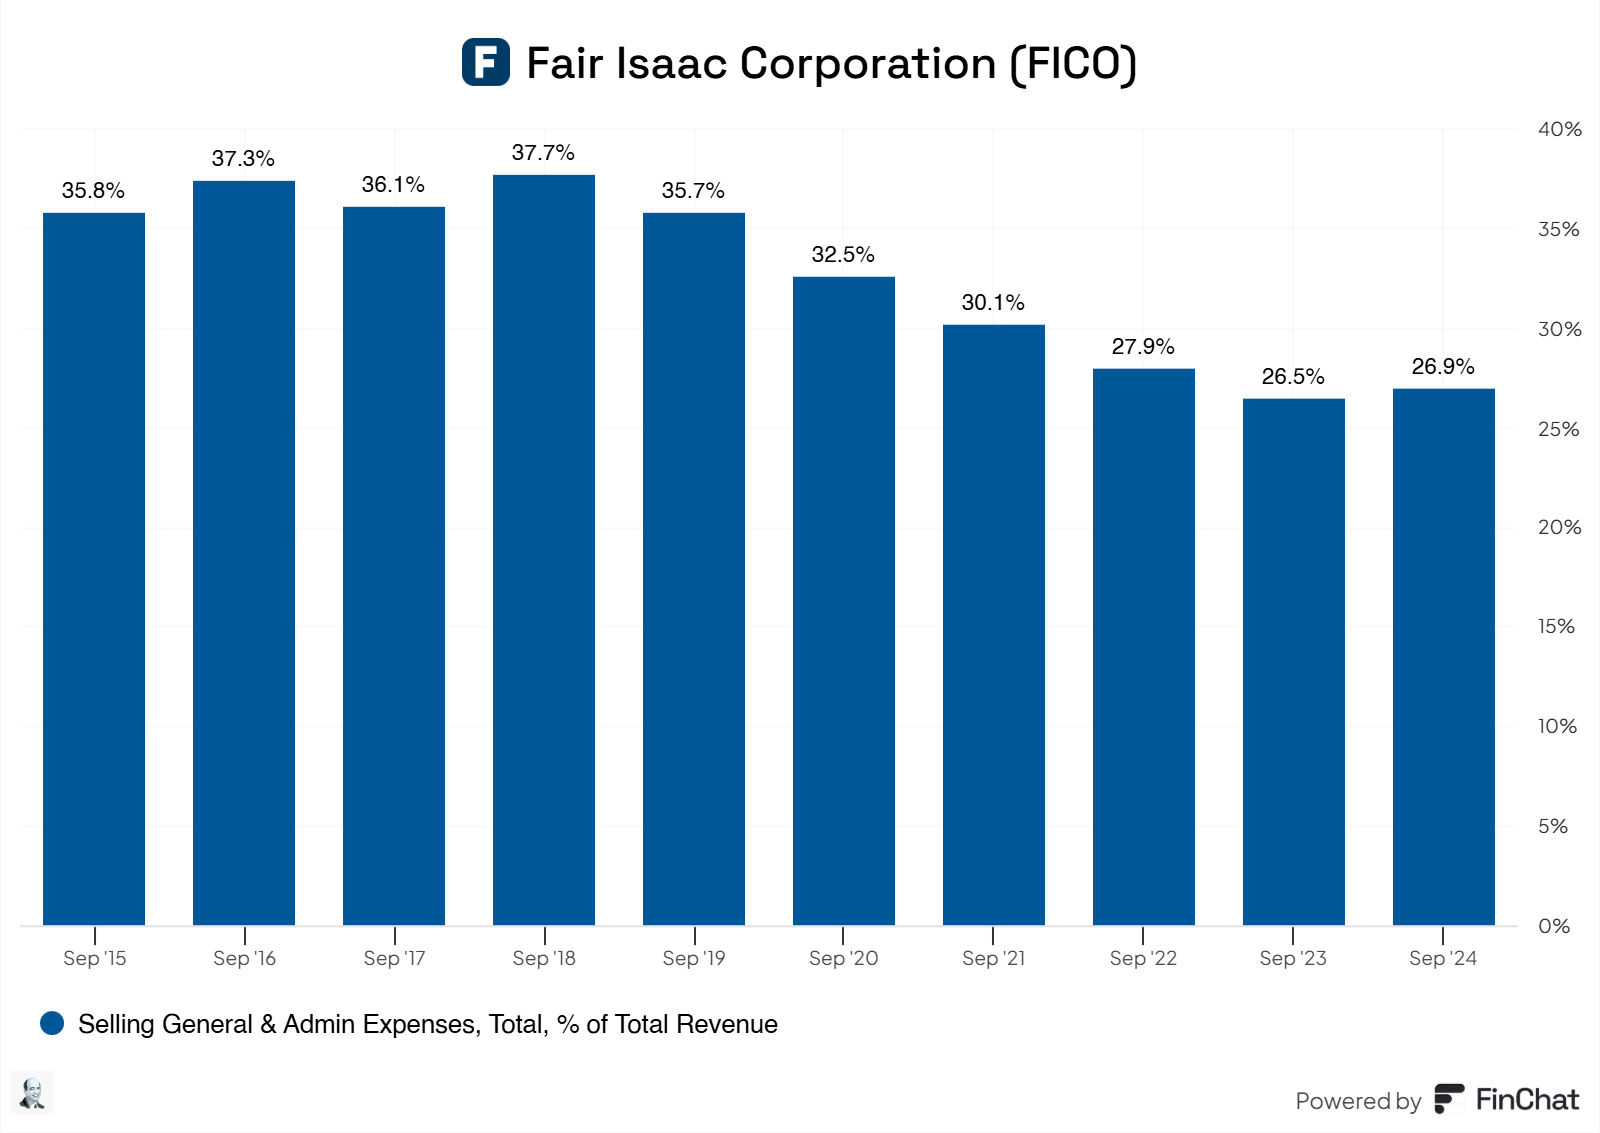
Simply put, Fico is becoming more efficient in managing its administrative expenses relative to their sales. This results from cost-cutting measures, better resource allocation, and increased economies of scale as sales grow, overall fantastic!
Now, over to Fico’s R&D!
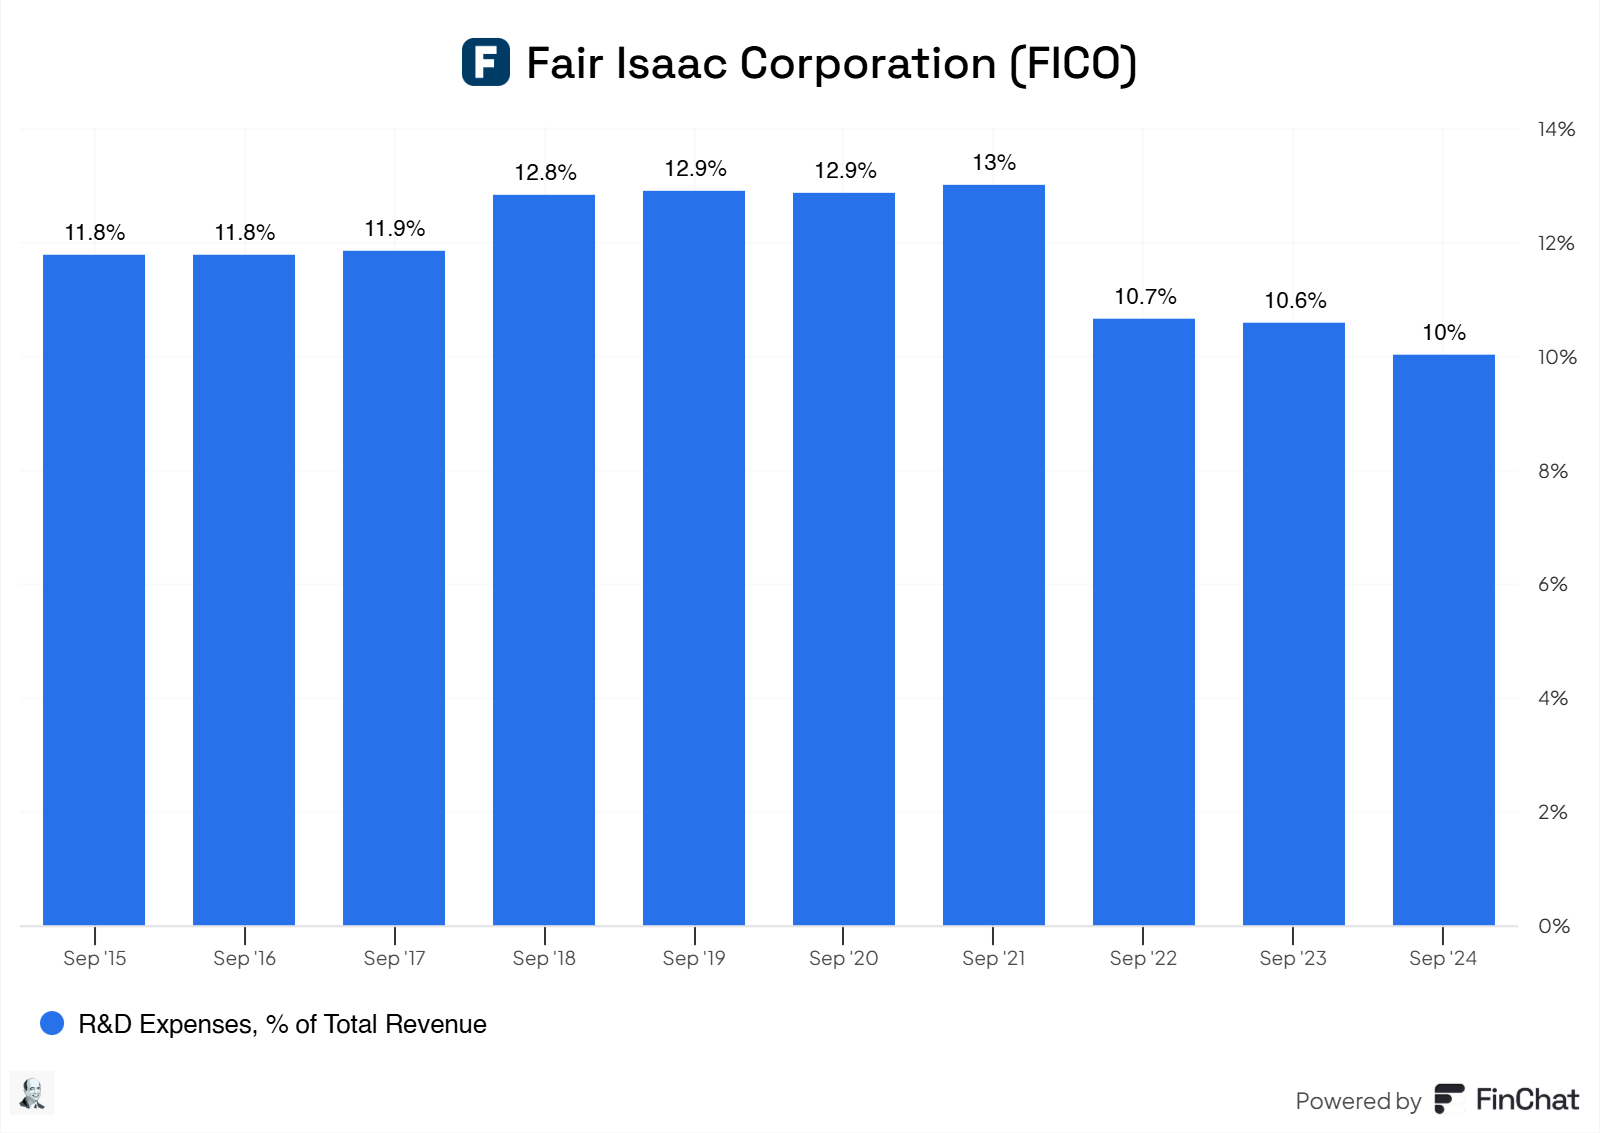
I’m pleased that Fico continues investing in research and development. Tech companies must ensure that they are the go-to service and continue to research to stay ahead of their closest competitors. Fico does this.
Let us check how their R&D effort plays out, shall we?
To calculate this, we use the following formula.
R&D efficiency score = Total Revenue Growth (%) / R&D spend (%) of the previous year

2016: 0.4
2017: 0.5
2018: 0.6
2019: 1.25
2020: 0.8
2021: 0.1
2022: 0.3
2023: 0.9
2024: 1.27
This tells us that Fico’s R&D effort consistently comes to the bottom half with a median TSR of 16%. It’s something we would likely see higher, especially for tech companies.
8.2 Capital Efficiency Review
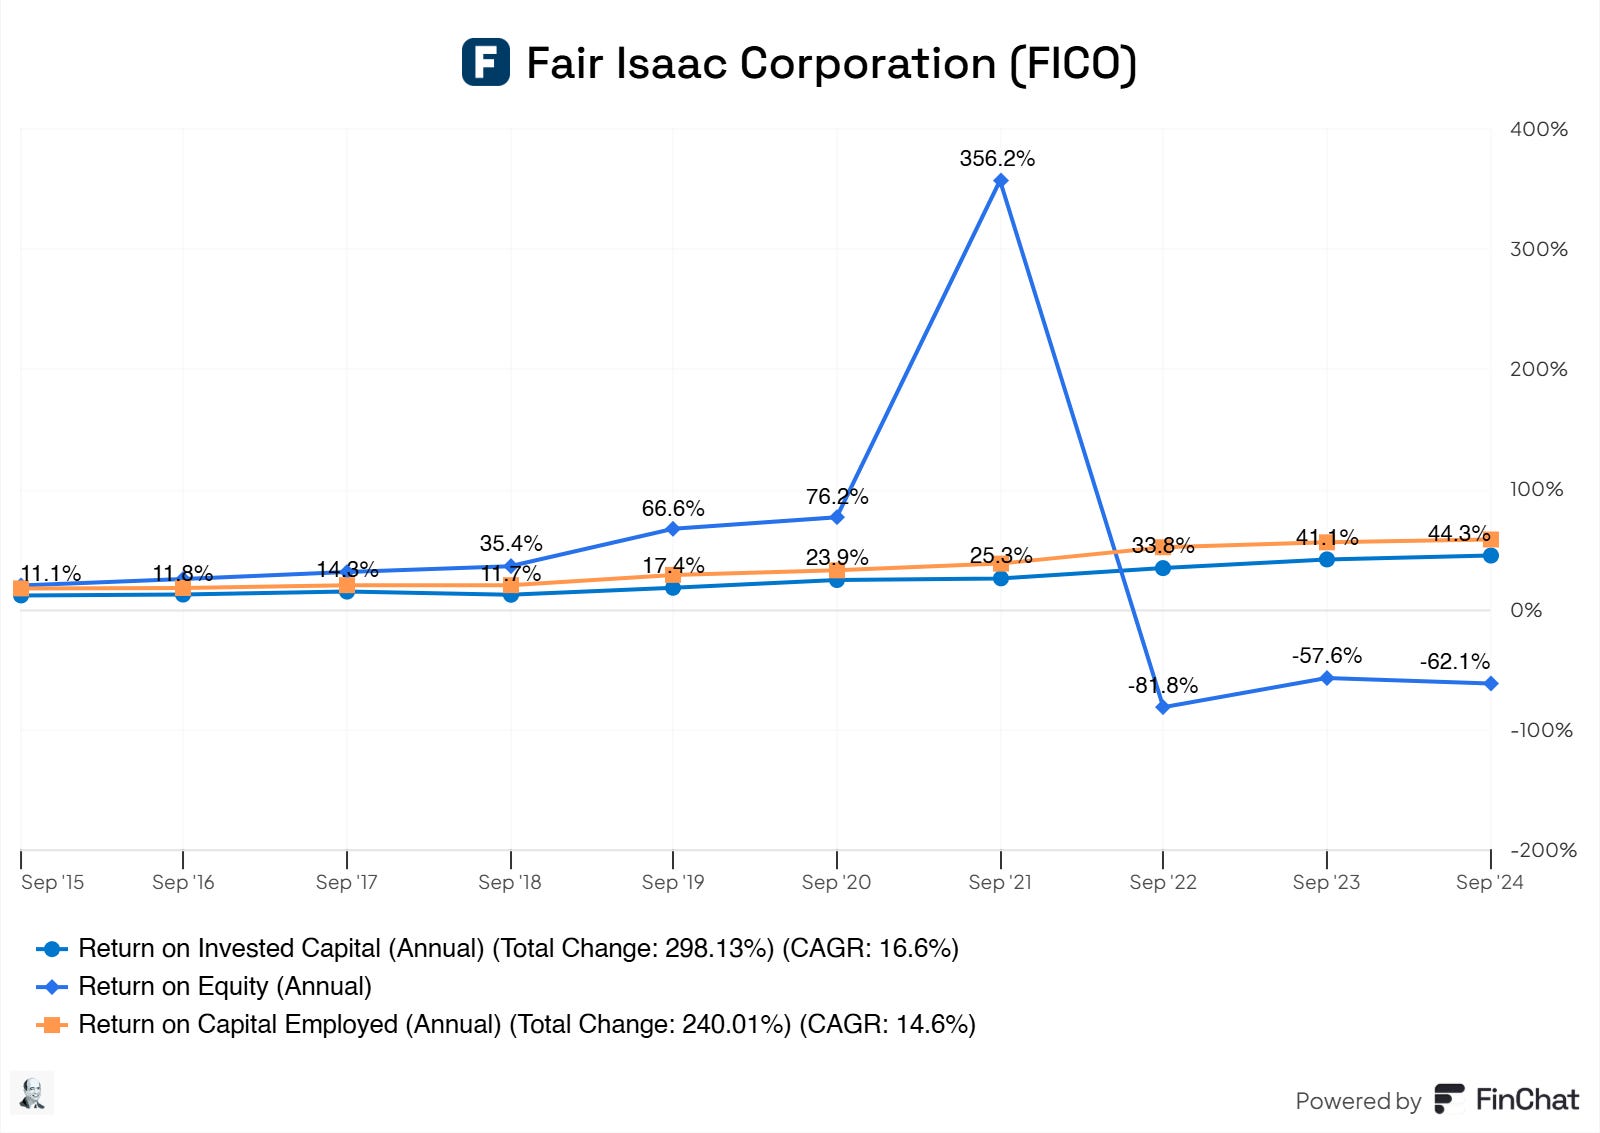
ROE is negative due to equity being negative as well, as expected. However, ROCE and ROIC are solid drivers for Fico. Their consistent growth is impressive. This indicates that management is picking solid, high-returning projects to invest in, which is excellent to see.
9. Profitability Assessment
9.1 Profitability, Sustainability, and Margins
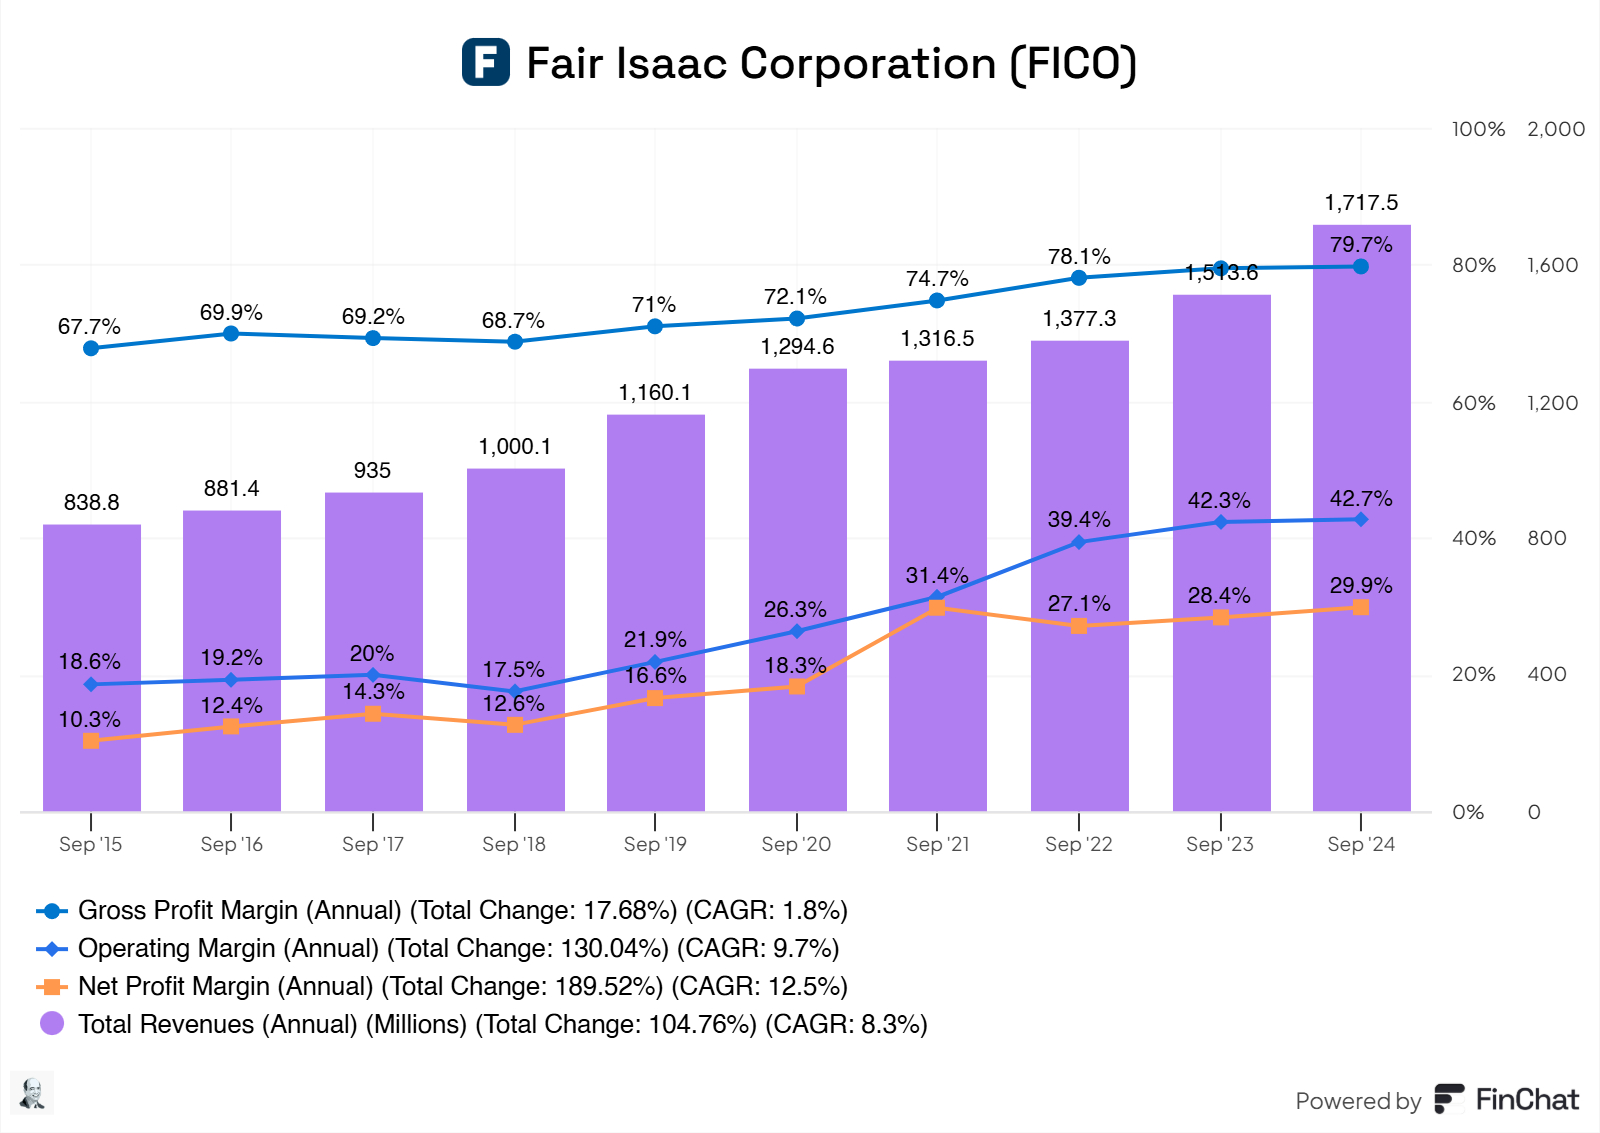
As I mentioned in the costs part of this investment case, the results are visible in the margins of the business. As Fico becomes more efficient, margin expansion becomes visible, as shown in the graph. Fico is boosting excellent margins, and I genuinely believe that these, at the current levels, are sustainable for Fico. If margins expand further, this should not come as a surprise. Fico is a business that, in the figure of speech, can solely run on an internet connection, driving away most of the costs. Due to their service/product nature is extremely good for scale, so margin expansion could continue in the medium term as Fico becomes even more efficient.
Fico’s total revenue is growing at solid rates currently, with a CAGR of 9.11%, which is also sustainable. Fico is running a monopoly in an industry that benefits many companies (I wonder if it benefits consumers). Their service/products have become the cornerstone of the credit scene and will not diminish in the next 10 years. There’s a lovely runway for Fico, and growth in the low teens wouldn't be challenging for Fico, maintaining this CAGR.
Moreover, Fico’s earnings are those of high quality. I measure the quality of a company's earnings by looking at the FCF/Net Income.
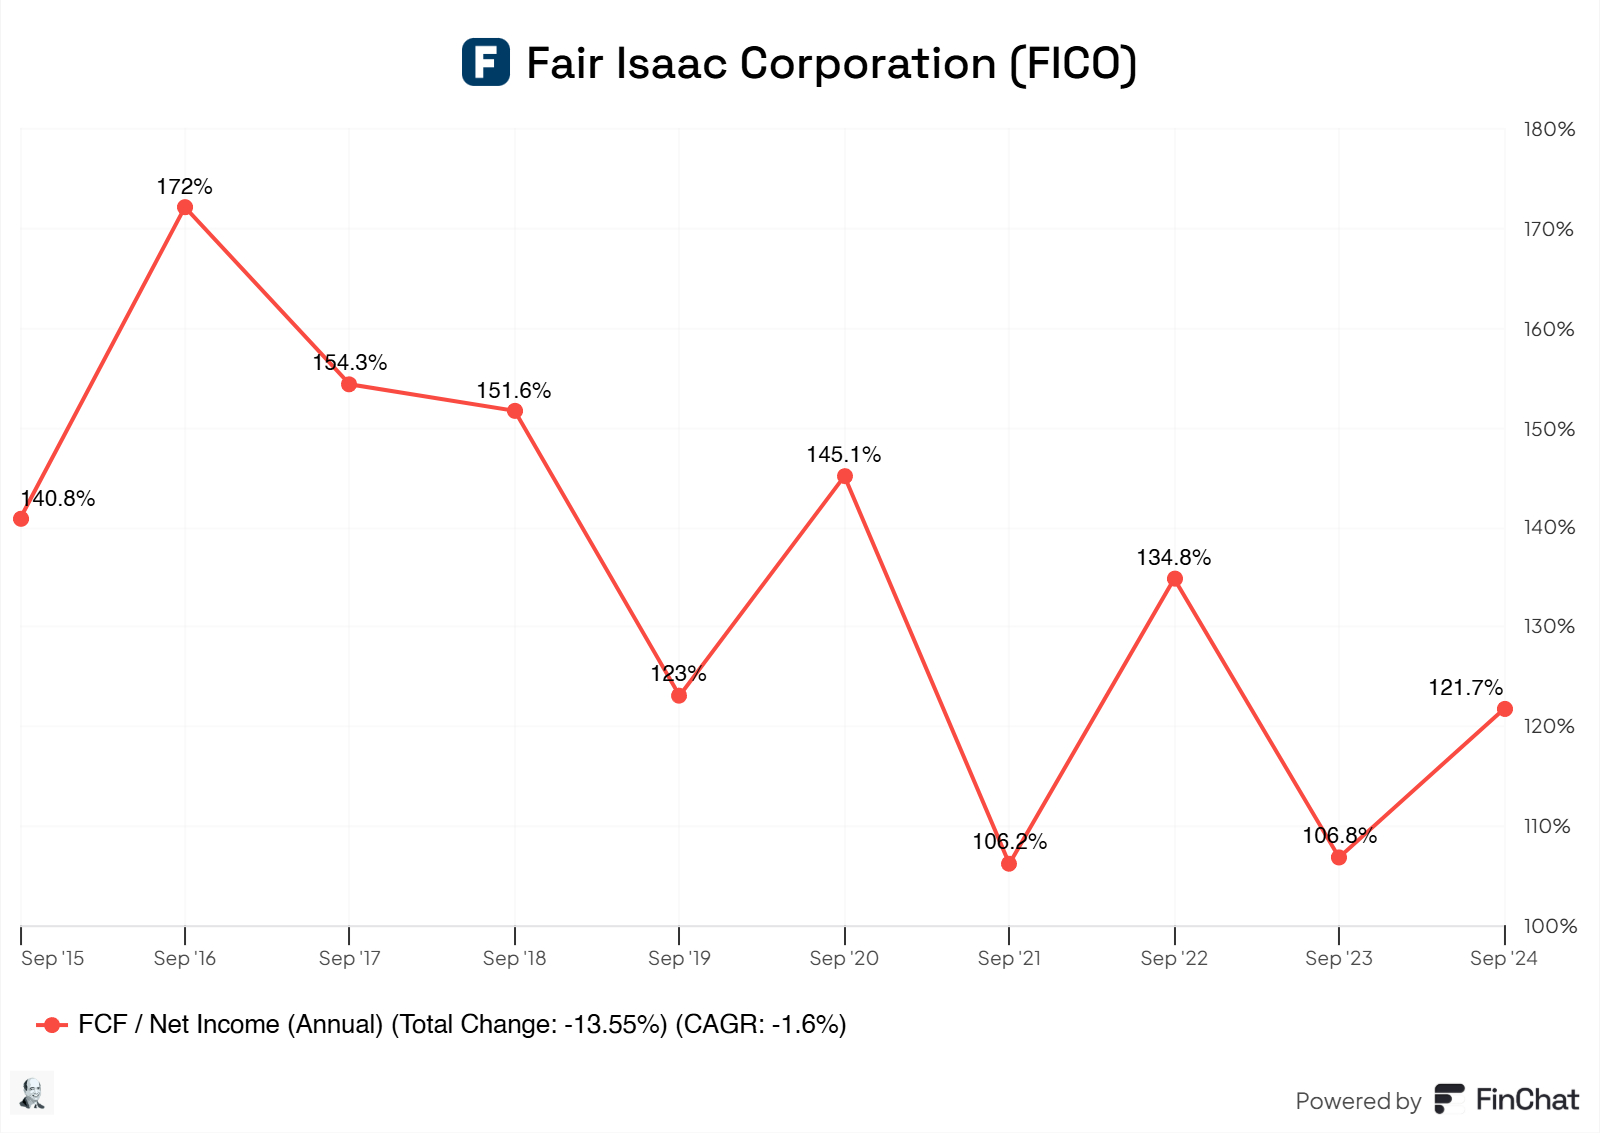
This tells us how Fico’s accounting profits are turning into real cash, the free cash flow, that Fico can use. Fico consistently generates more cash than it shows on profit on the business's income statement.
>100%: Exceptional; the company generates more free cash flow than its net income, due to non-cash expenses (e.g., high depreciation).
~100%: Healthy; net income is well-aligned with free cash flow.
<80%: This could be a concern; investigate reasons for the discrepancy (e.g., working capital, capex, or earnings manipulation).
9.2 Cash Flow Analysis
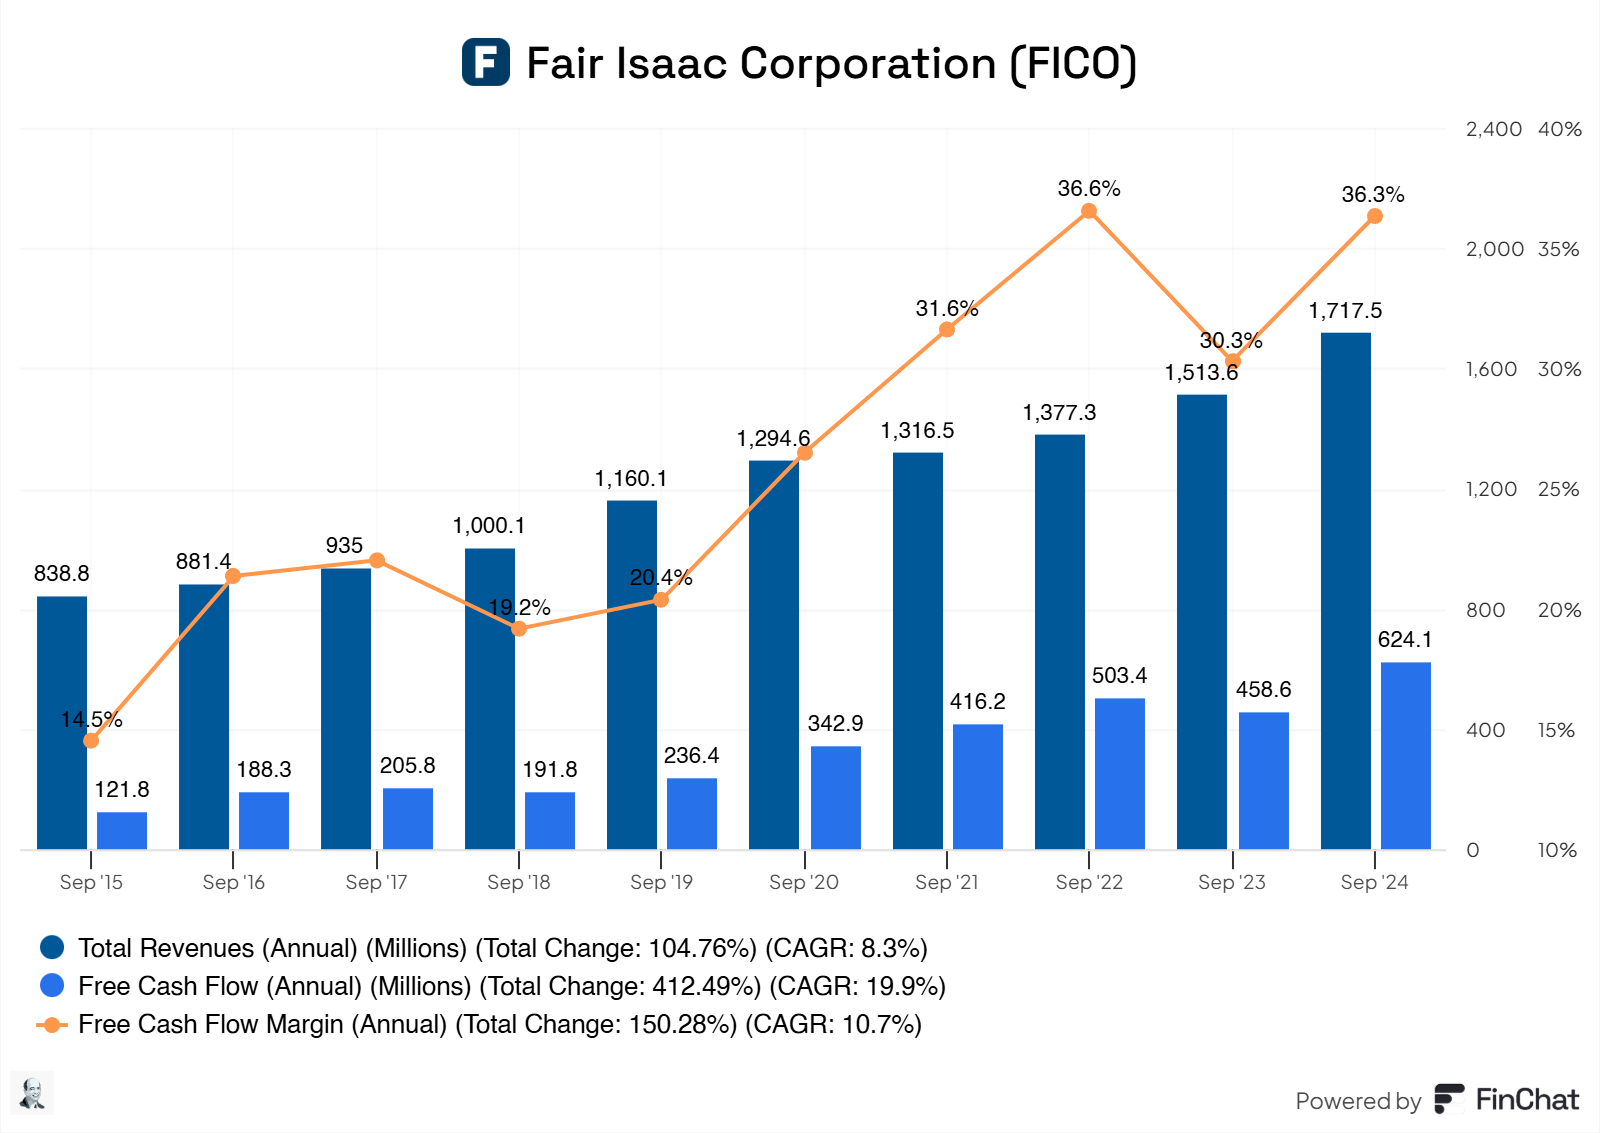
At first glance, this seems excellent. Fico generates solid total revenues and converts them at high rates into free cash flow, as shown by the free cash flow and free cash flow margin.
But, there a snake in the grass here. 🐍
Let me visualize the snake here; take a look.
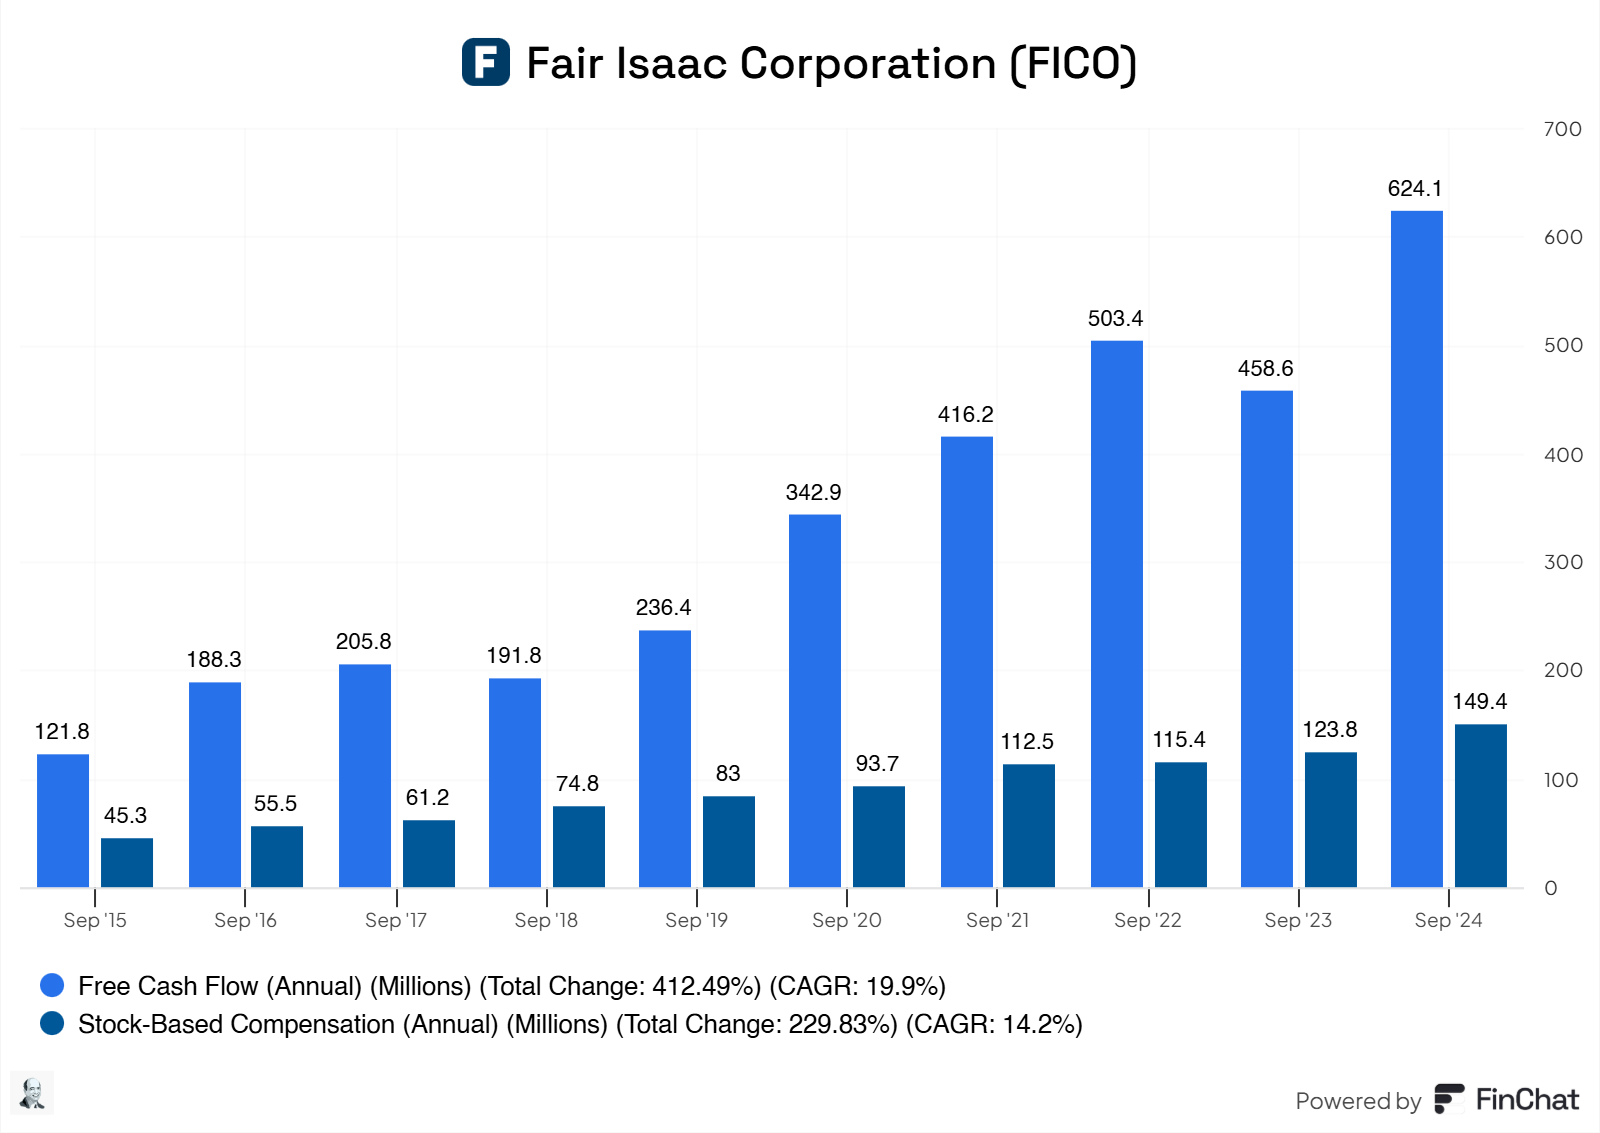
Fico's relatively large stock-based compensation impacts its free cash flow and boosts its free cash flow margin. Therefore, remove the SBC and calculate the true free cash flow margin.
True FCF:
2015: $76.5M
2016: $132.8M
2017: $144.6M
2018: $117.0M
2019: $153.4M
2020: $249.2M
2021: $303.7M
2022: $388.0M
2023: $334.8M
LTM: $474.7M
Now, let us calculate the true FCF margin of FICO
FCF Margin = (SBC ADJ. FCF / Total Revenue) x 100
2015: 9.12% (14.5% is reported incl. SBC)
2016: 15.06% (21.4% is reported incl. SBC)
2017: 15.47% (22% is reported incl. SBC)
2018: 11.70% (19.2% is reported incl. SBC)
2019: 13.22% (20.4% is reported incl. SBC)
2020: 19.01% (26.5% is reported incl. SBC)
2021: 28.72% (31.6% is reported incl. SBC)
2022: 26.96% (36.6% is reported incl. SBC)
2023: 27.29% (30.3% is reported incl. SBC)
LTM: 29.55% (36.3% is reported incl. SBC)
This shows the true discrepancy between the FCF and FCF margin. SBC is a real cost to shareholders. By subtracting SBC, we get a clearer picture of the genuinely available FCF to equity holders. It gives a more accurate picture of the cash flow generated relative to revenue.
Still, Fico has excellent FCF margins across the board, but they’re artificially inflated due to the heavy SBC.
10. Growth Projections
EPS Fwd 2Yr CAGR: 24.5%
EPS LT Growth Est CAGR: 32.0%
Rev 5Yr CAGR: 8.2%
Rev 10Yr CAGR: 8.1%
Rev Fwd 2Yr CAGR: 15.8%
Overall, excellent growth for Fico is on the horizon, which is something I’m not willing to bet against. Primarily due to the near-monopoly Fico is running (they’re currently in battle with the DOJ with an anti-Trust on their monopoly).
11. Value Proposition
11.1 Dividends Analysis
Fico paid dividends in 2015, 2016, and 2017 but stopped doing so in 2017, and for the better. The company still has an excellent runway for growth and should boost its dominance by pumping all the possible cash back into the business and not paying shareholders via dividends. Once the market and Fico have matured, dividends could be a good option for Fico, just not now.
10.2 Share Repurchase Programs
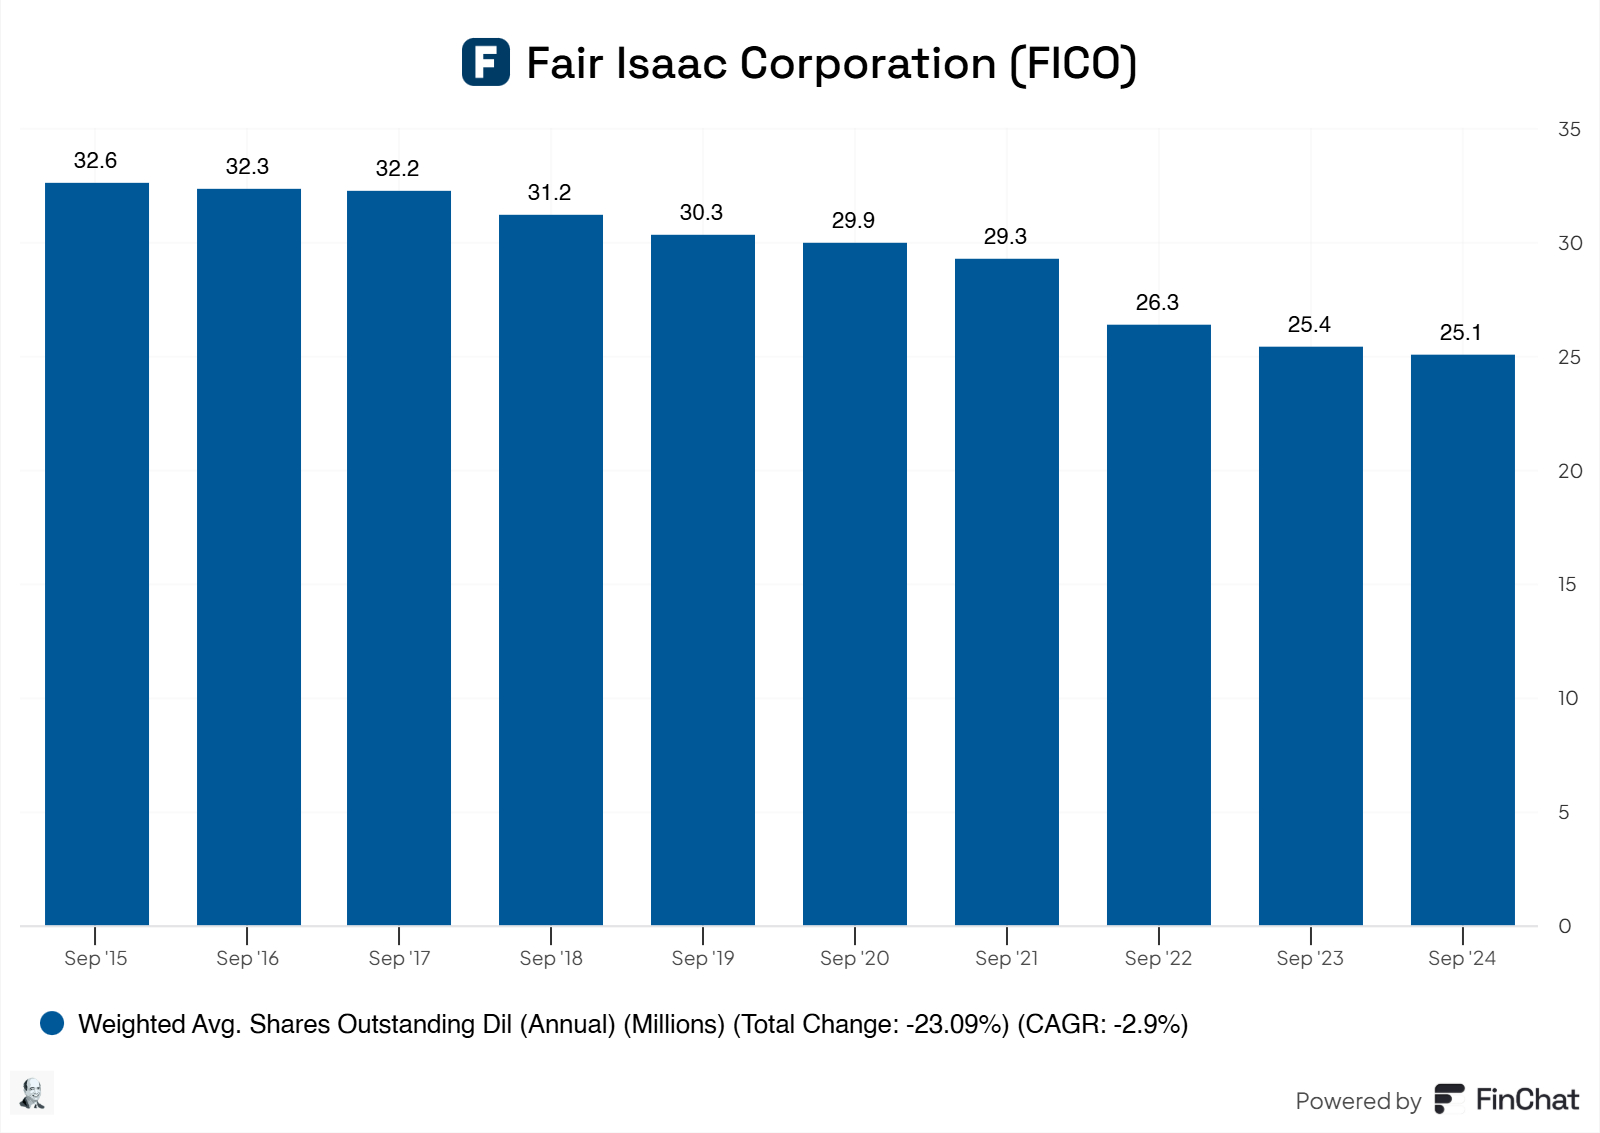
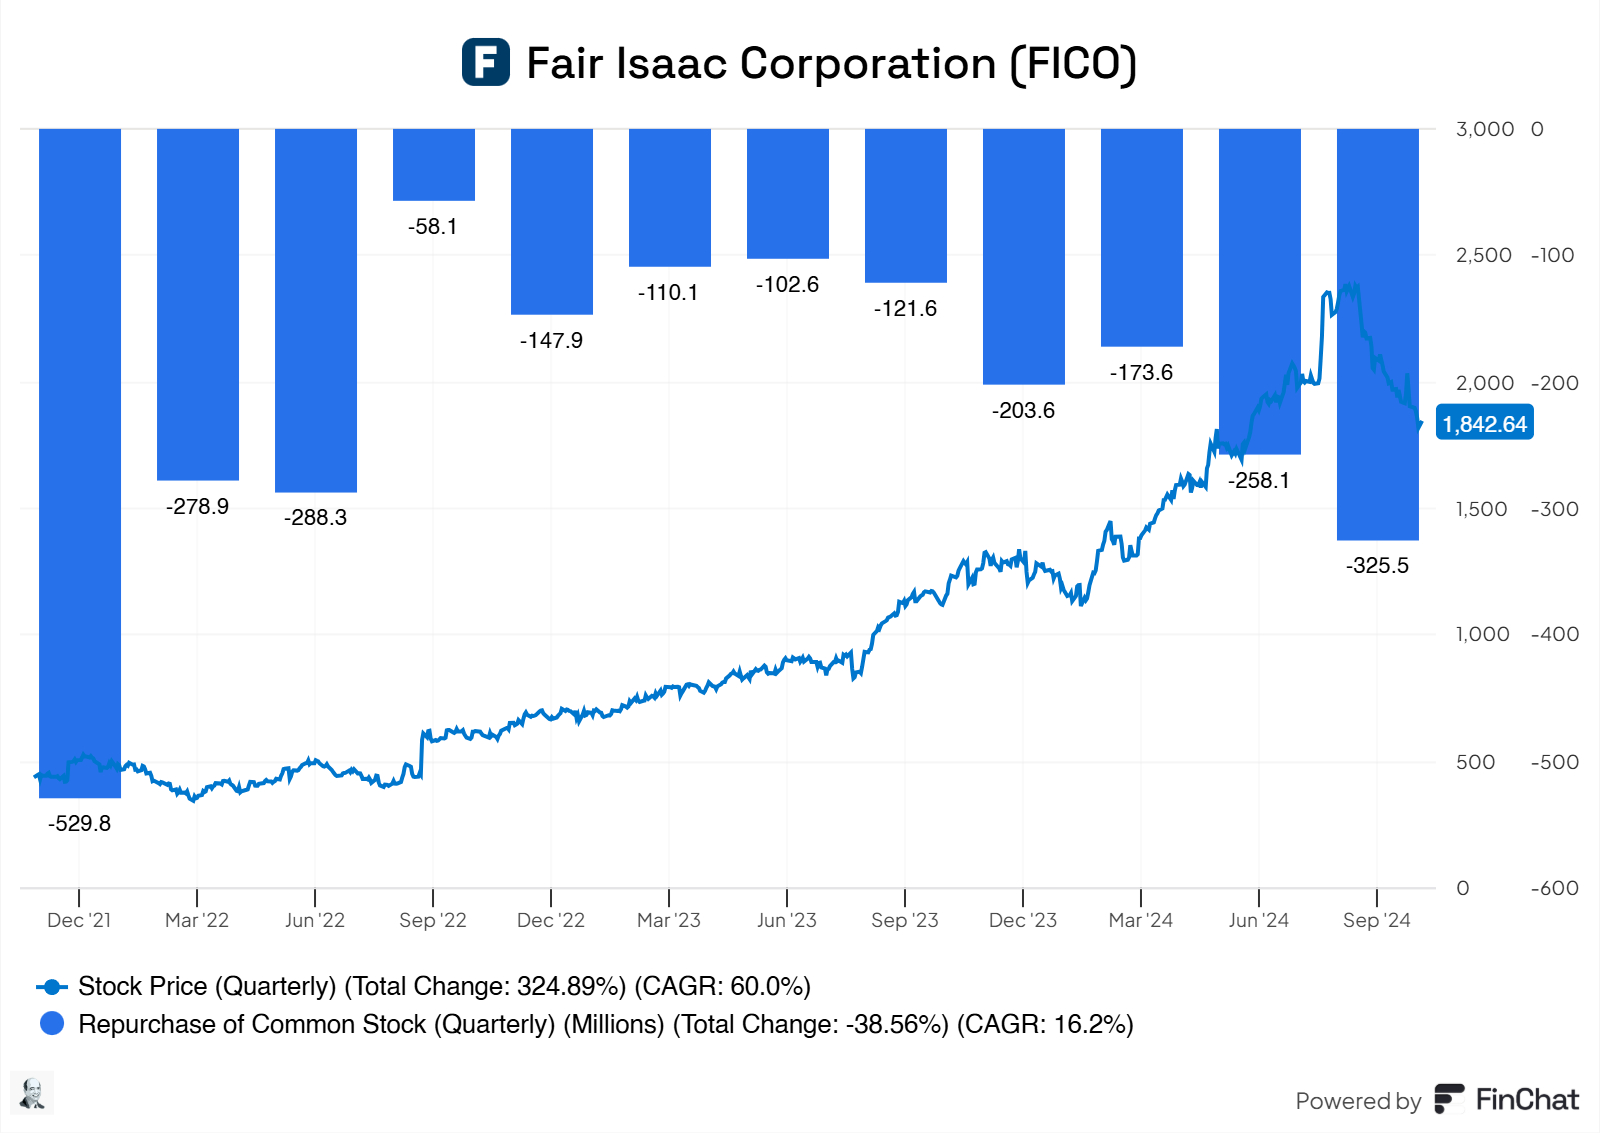
Fico has been engaging in solid stock repurchases, which is good. This, in turn, drives up per-share revenues, free cash flow, and earnings for existing shareholders, driving up value on a per-share basis.
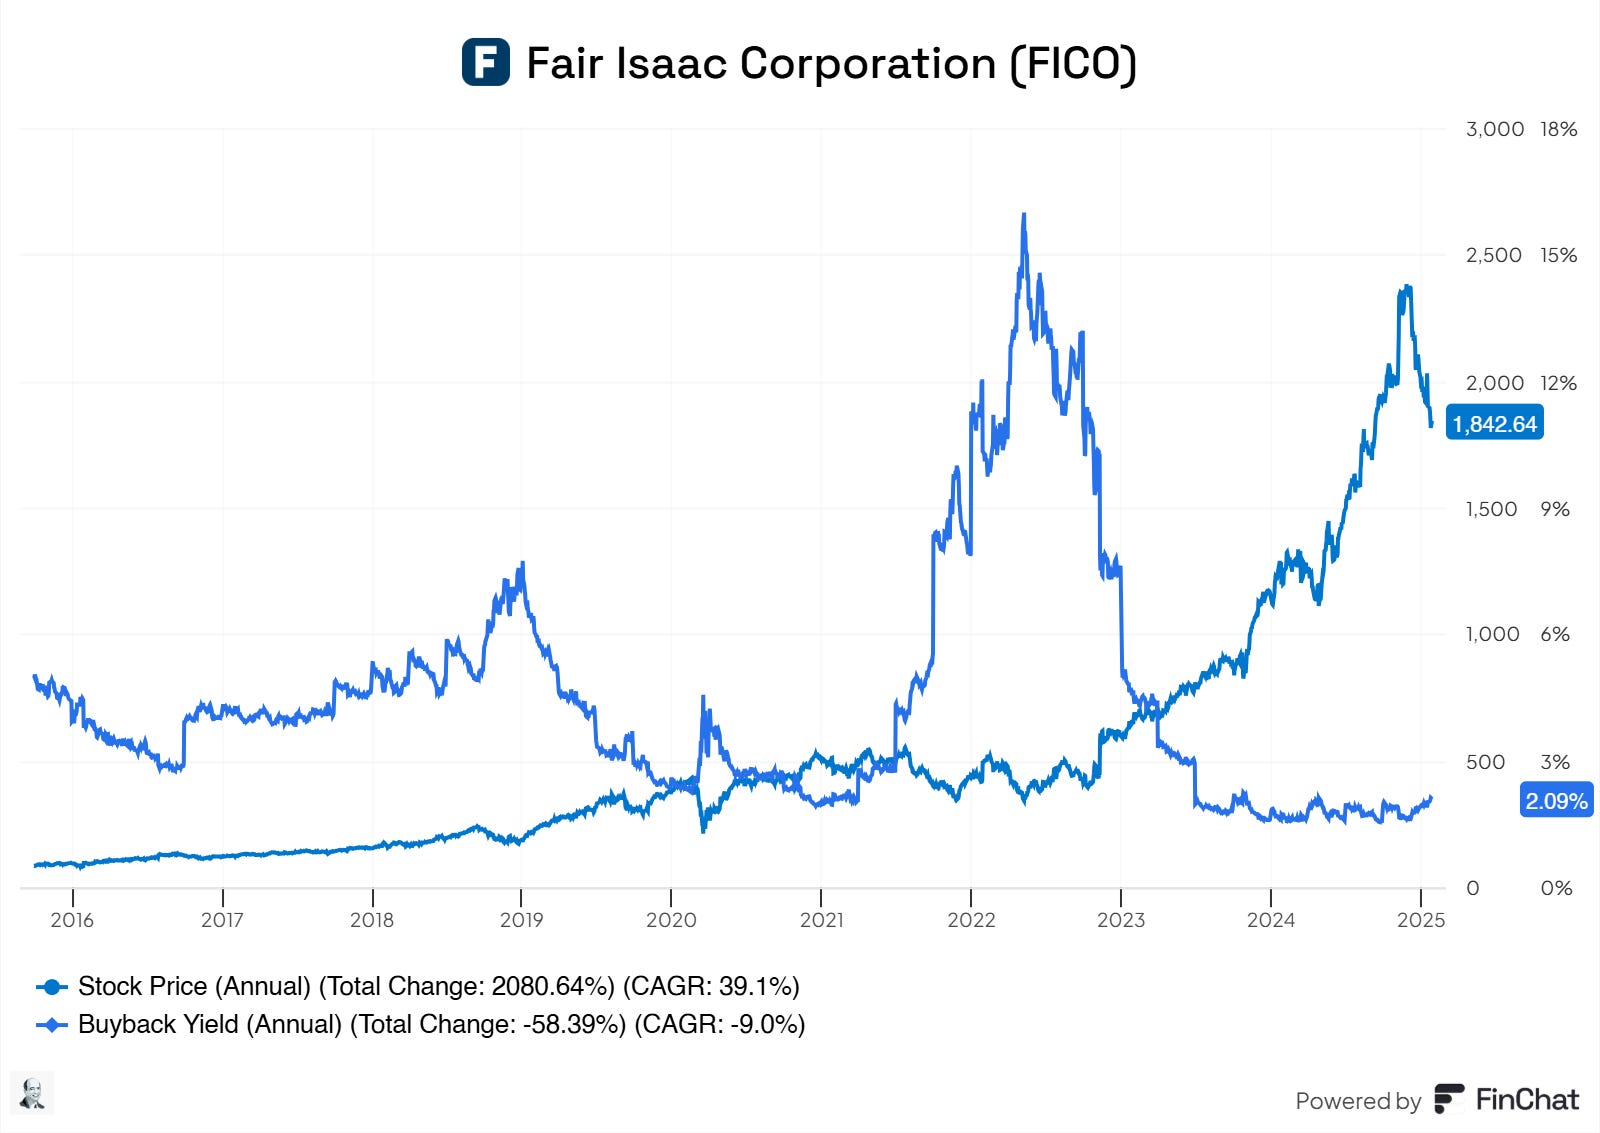
Fico has been buying back shares when prices decline, showing that Fico does think about creating actual value with their share buybacks by correctly timing when to repurchase shares. Since Fico has been running up, the buyback yield has been low due to the inflated price of the stock, giving less room for effective share repurchase programs, which is understandable. This indicates to us, the investors that management does think about creating real value when it comes to buying back shares.
11.3 Debt Reduction Strategy
As of now, debt is ramping up quickly. Management did say that there’s a plan to start reducing debt using their FCF, which is good. As I mentioned, their debts are getting out of control (even though 59% is locked in rates). These debts do carry a burden since the remaining debt isn’t fixed and could harm their EBIT/Interest ratio, making Fico a debt-burden business and destroying value by the interest on their debt.
12. Quality Rating

Overall, Fico scores an eight, which is good! Unfortunately, SBC and their meh R&D effort did pull down this number by one point.
13. Valuation Assessment
Let us crunch up some numbers!

Perpetual Growth Rate: 3%
RRR (Discount Rate/ Required Rate of Return): 10%
A simple DCF tells us that the fair value per share is roughly $868.46 with a RRR of 10%. Some excellent comments were made in my Ferrari post, so let us try this DCF with a lower RRR. Because Fico is a less risky asset and a higher RRR isn’t always optimal, let us try 8% RRR now.
(Note: I use the discount rate as a required rate of return. This can raise eyebrows with others who use the discount rate as WACC or use it to measure the ‘‘riskiness’’, or lack of risk, of the business. Whatever suits you, do it. Just know that for me, it is the required rate of return. Moreover, I use a perpetual growth rate that doesn't outgrow the national DGP average growth. Otherwise, this would mean that a company would outgrow the GDP. Do whatever suits your type of evaluating. ;-) )
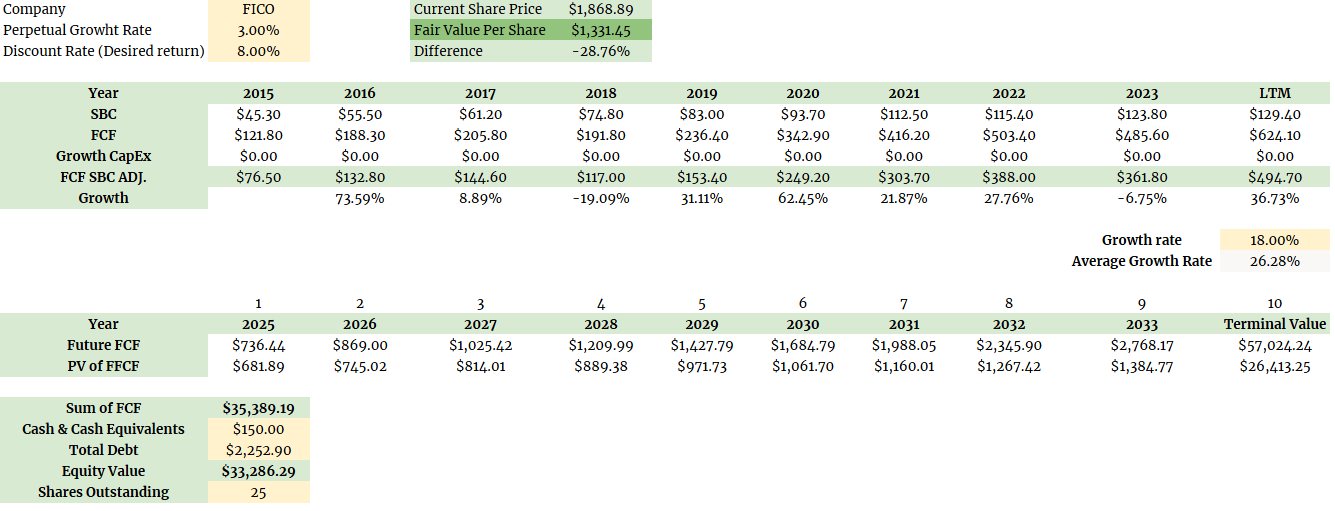
Perpetual Growth Rate: 3%
RRR (Discount Rate/ Required Rate of Return): 8%
Even then, the fair value is far below the current price, at $1.133,45 per share, a difference of -28.76%.
Now, let us check the reverse DCF. Also, I will use the RRR of 10% and 8% with a perpetual or terminal growth rate of 3%.

With an RRR of 10%, currently, roughly 28% and 28.50% are baked into the price is too expensive for my liking with a 10% RRR.
Now, let us check with an 8% RRR.
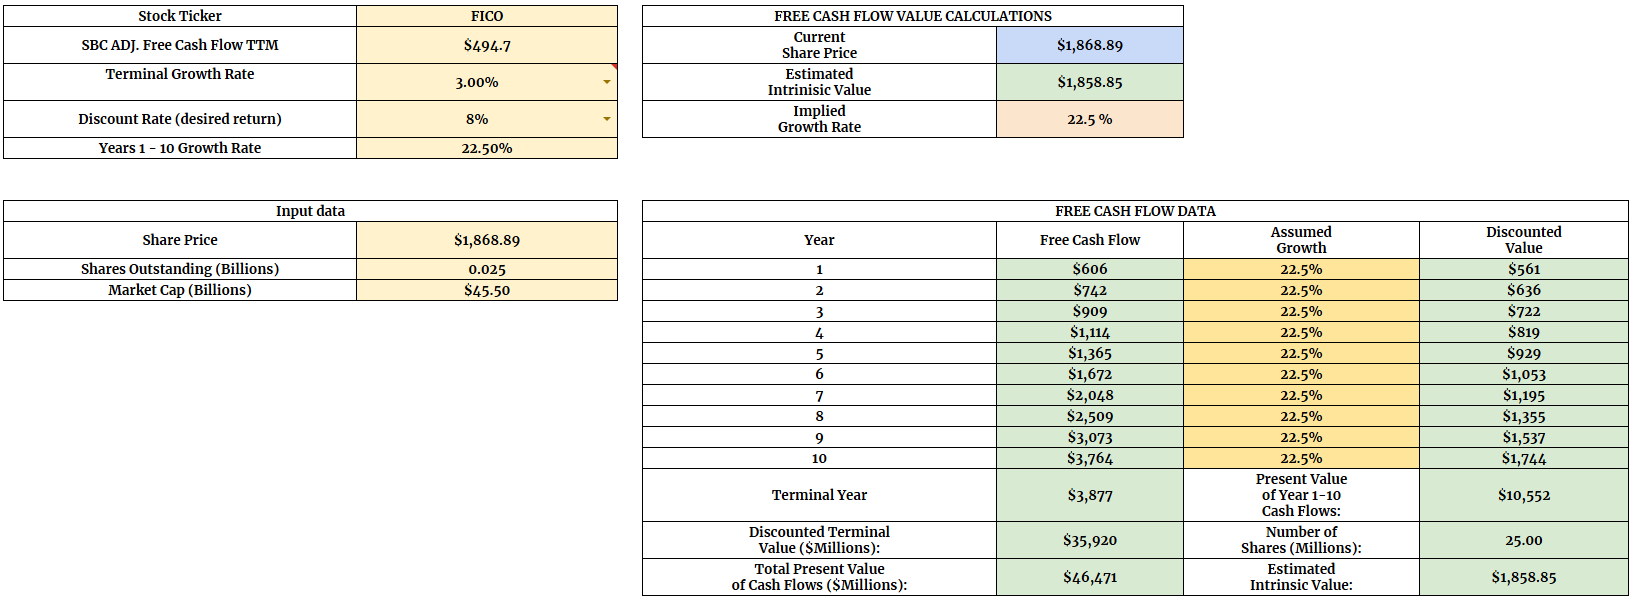
Here, we see that with an 8% RRR, 22.50% is baked into the current price of Fico, which is still a bit expensive.
I see more fitting growth of FCF with a CAGR of 18% to 19%, but I'm skeptical of a 22.50% year-over-year growth rate for the next 10 years.
This tells me that Fico is an excellent business but is too expensive.
Thank you for reading.
PS…. if you’re enjoying FluentInQuality, can you take 3 seconds and refer this edition to a friend? It goes a long way in helping me grow the newsletter (and bring more quality investors into the world). Whenever you get a friend to sign up using the link below, you will be one step closer to some fantastic rewards.
Lastly, I would love to hear your input on how I can make FluentInQuality even more helpful for you! So, please leave a comment with:
Ideas you’d like covered in future posts.
Your takeaways from this post.
I read and respond to every comment! :-)
And remember…
Great investments don’t shout—they compound quietly.
- Yorrin (FluentInQuality)
Disclaimer
By reading my posts, subscribing, following me, and visiting my Substack, you agree to my disclaimer, which can be read here.
Loved this. Great to learn about this company as the price keeps falling.
Great write up. Waiting for a better price