Fastenal: A True Compounder or a Hidden Trap?
Unpacking the Growth Story Behind the Numbers—Is It Time to Hold or Fold?
Hey there, partner! 👋
Before we dive in, I need your support to keep these articles FREE.
If you're enjoying this content, here's how you can help:
Like the article
Please share it on your social media
Comment below to join the conversation
Your engagement means everything. Thanks for being part of the journey! Now, let's get started.
Welcome back to another deep dive into the world of investments. Today, we’re shifting gears to analyze Fastenal—the reigning titan in the nuts and bolt.
If you’re new here or missed my previous articles, feel free to catch up:
If you haven’t already, hit that follow button for FREE insights to fuel your investment journey. Whether you’re just starting or a seasoned investor, there’s something here for everyone.
Once you’ve finished this analysis, I’d love to hear your thoughts! Be sure to comment, drop a like, and share it with your Substack community if this resonates with you. Your support makes all the difference! 😊
Table of contents
Corporate Analysis
1.1 Business Overview
1.2 Revenue BreakdownExecutive Leadership
2.1 CEO Experience
2.2 Employee Satisfaction Ratings
2.3 CEO Value CreationInside- and institutional ownership
Competitive and Sustainable Advantages (MOAT)
Industry Analysis
5.1 Current Industry Landscape and Growth Prospects
5.2 Competitive LandscapeRisk Assessment
Financial Stability
7.1 Asset Evaluation
7.2 Liability AssessmentCapital Structure
8.1 Expense Analysis
8.2 Capital Efficiency ReviewProfitability Assessment
9.1 Profitability, Sustainability, and Margins
9.2 Cash Flow AnalysisGrowth Analysis
10.1 Historical Growth Trends
10.2 Future Growth ProjectionsValue Proposition
11.1 Dividend Analysis
11.2 Share Repurchase Programs
11.3 Debt Reduction StrategiesQuality Rating
SWOT Analysis
Valuation Assessment
Conclusion
1. Corporate Analysis
1.1 Business Overview
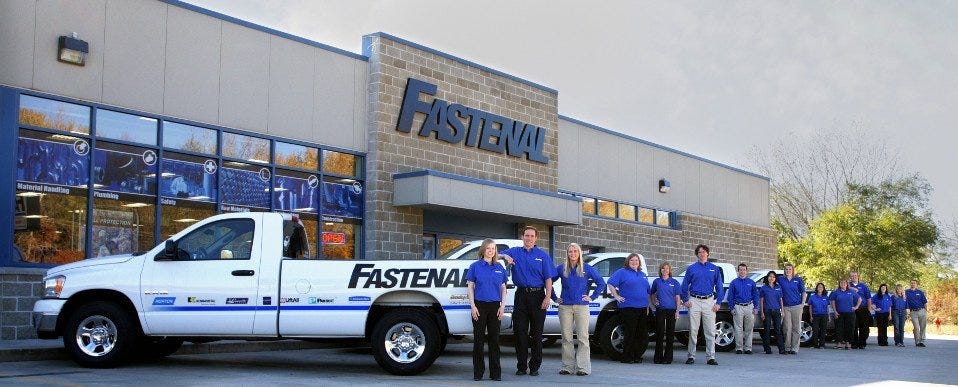
Fastenal Company, together with its subsidiaries, engages in the wholesale distribution of industrial and construction supplies in the United States, Canada, Mexico, North America, and internationally. It offers fasteners and related industrial and construction supplies under the Fastenal name. The company's fastener products include threaded fasteners, bolts, nuts, screws, studs, and related washers, which are used in manufactured products and construction projects, as well as in the maintenance and repair of machines. It also offers miscellaneous supplies and hardware, including pins, machinery keys, concrete anchors, metal framing systems, wire ropes, strut products, rivets, and accessories. The company serves the manufacturing market, which comprises original equipment manufacturers, maintenance, repair, and operations, as well as the non-residential construction market, including general, electrical, plumbing, sheet metal, and road contractors. It also serves farmers, truckers, railroads, mining companies, schools, retail trades, oil exploration, production, refinement companies, and federal, state, and local governmental entities. The company distributes its products through a network of 3,209 in-market locations and 15 distribution centers. Fastenal Company was founded in 1967 and is headquartered in Winona, Minnesota.
1.2 Revenue Breakdown
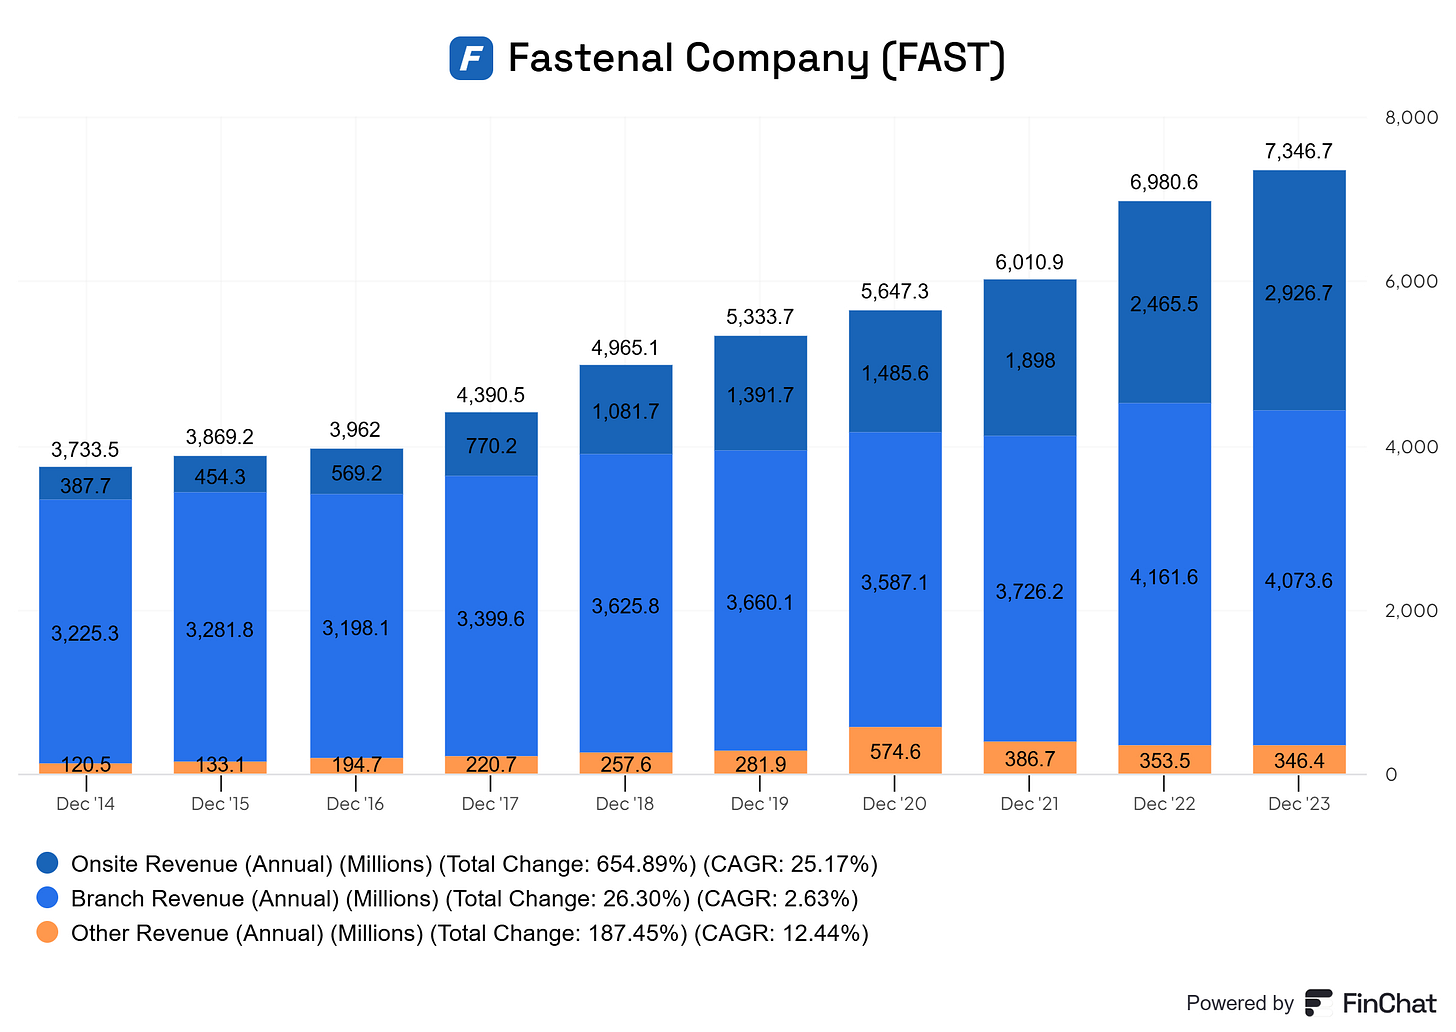
Fastenal's revenue lines are split up into Onsite revenue, Branch Revenue, and Other revenue.
Onsite Revenue: Revenue generated from dedicated sales and service sites within or near a customer’s facility. These Onsite locations provide customized inventory management solutions and immediate access to essential products, catering directly to the customer's’ operational needs.
Branch Revenue: Revenue derived from Fastenal's network of local branches, which act as distribution hubs and customer service centers. These branches support regional operations by offering a wide range of products and personalized services to meet customer demands efficiently.
Other Revenue: This category includes income from Fastenal's vending solutions, e-commerce platforms, and value-added services designed to streamline procurement processes and enhance customer operations.
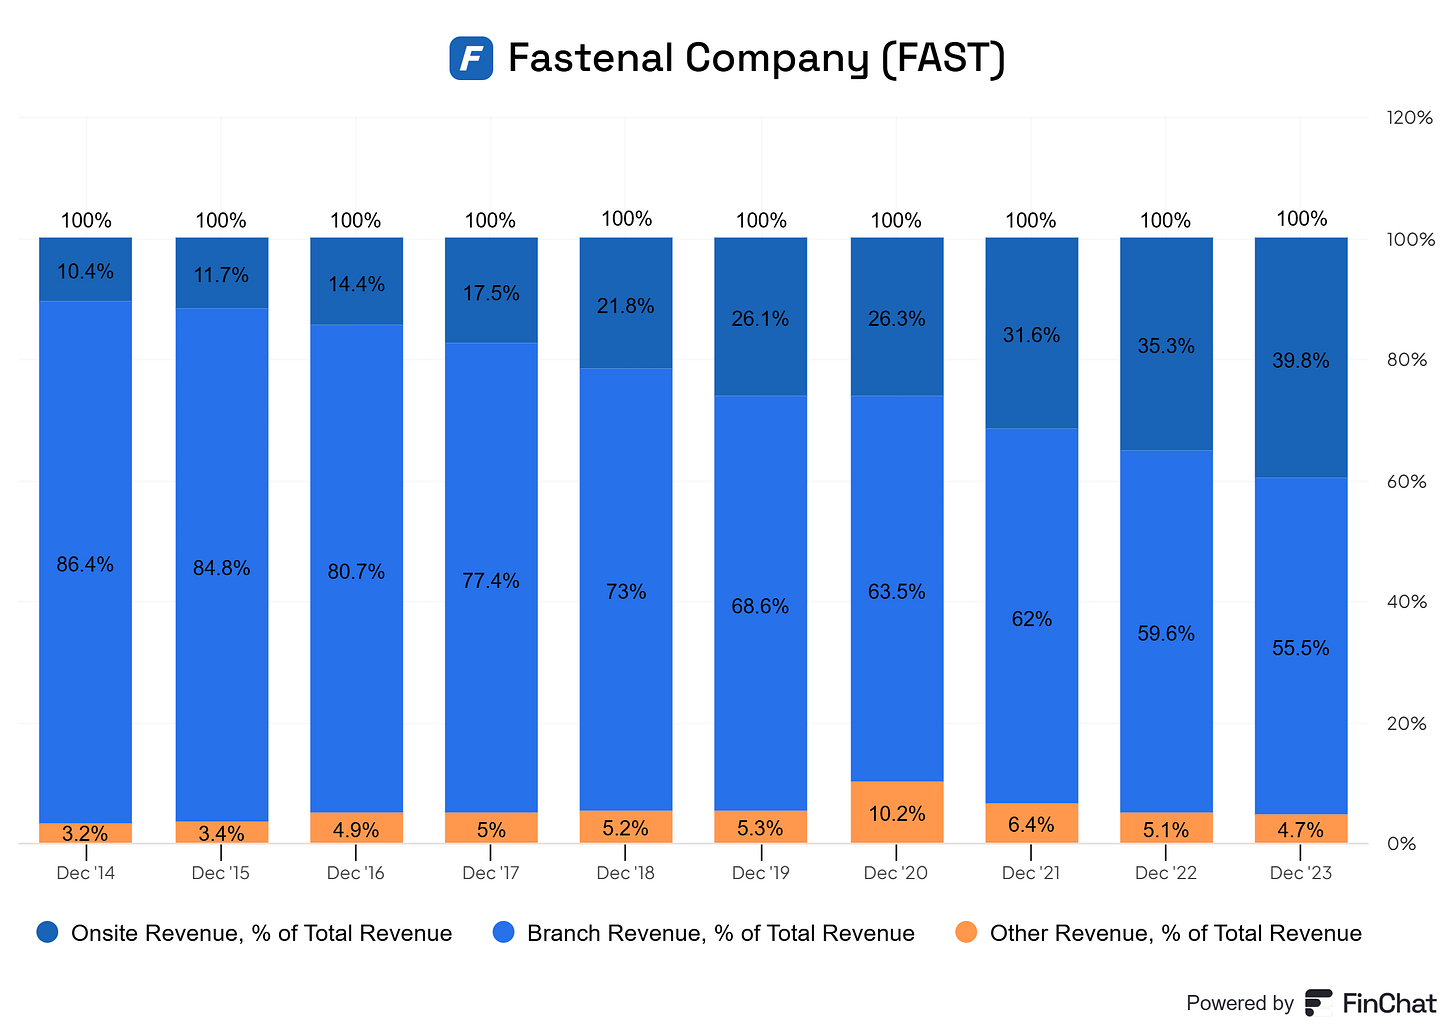
Fastenal is undergoing a clear strategic shift away from its reliance on branch revenue. In 2014, branches accounted for 86% of the company’s total revenue. Since 2016, we’ve observed a steady decline in this dependency, with the branch segment now representing approximately 55% of Fastenal’s total revenues.
This transition is a promising development. Businesses with overly concentrated revenue streams face greater risk, as challenges in one area can disproportionately impact overall performance. By reducing its reliance on branch revenue and moving toward a more balanced distribution with Onsite revenue, Fastenal is building greater resilience and sustainability. This diversification should encourage shareholders, which signals a more stable and adaptable business model.
As for the "Other Revenue" segment, which includes vending solutions, e-commerce platforms, and value-added services, this area has remained stable year-over-year. While it’s not a primary focus for Fastenal, it is a valuable supplementary revenue stream—essentially a “bonus” that adds to the overall business without requiring heavy strategic emphasis.
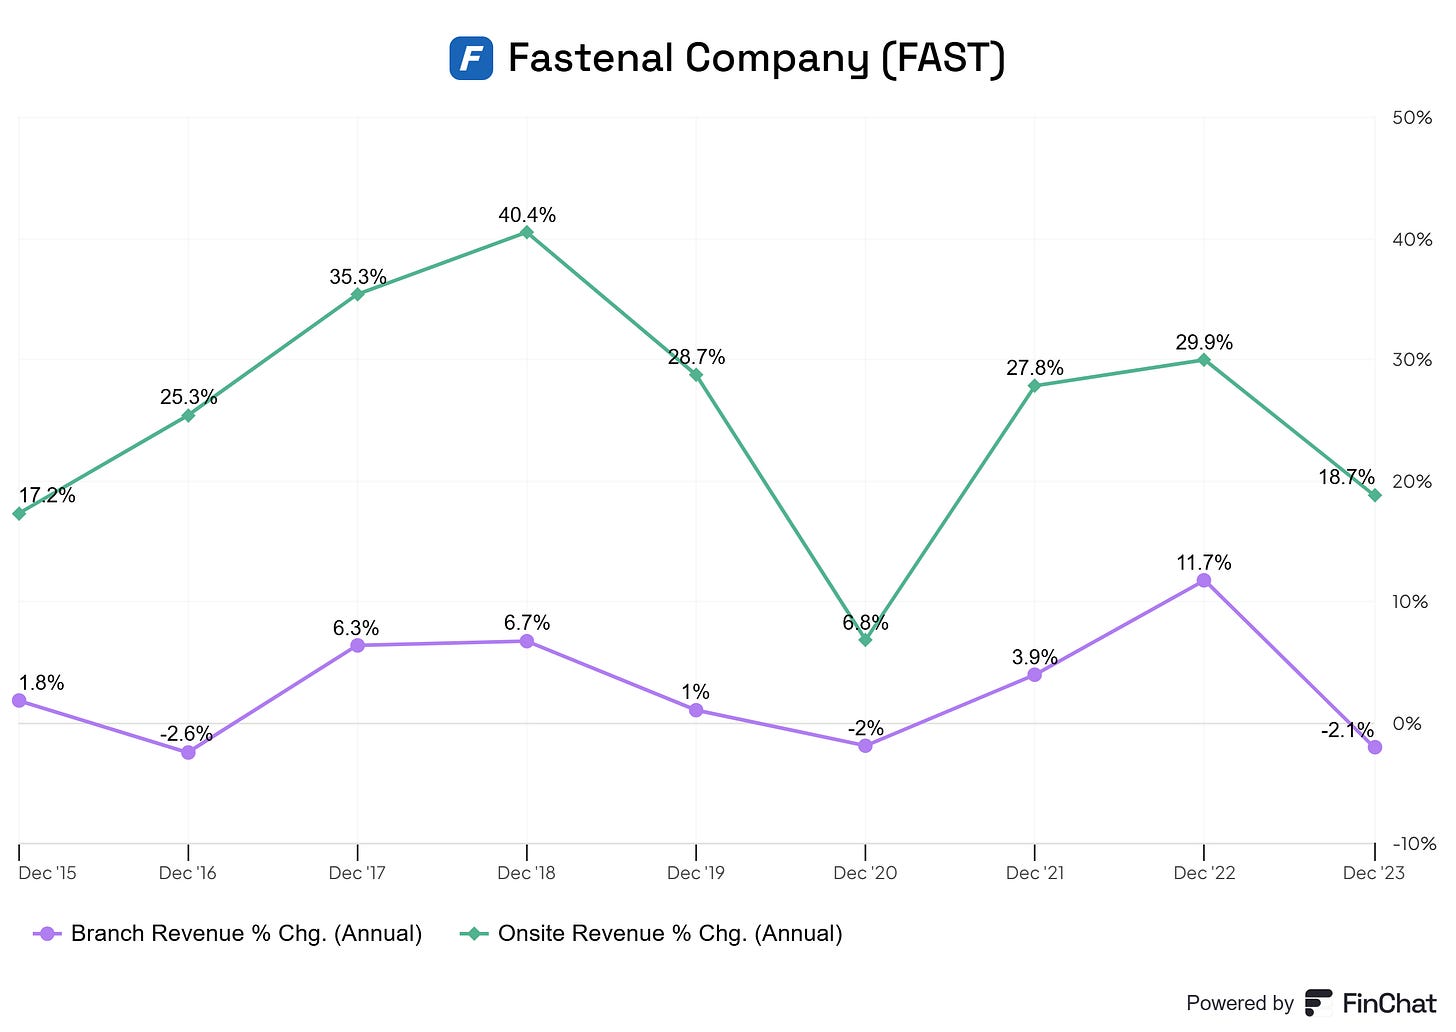
However, there are signs of a slowdown in branch revenue growth. Ideally, we would see steady year-over-year growth across all segments, with one segment expanding faster to create a balanced revenue mix. For Fastenal, this is not entirely the case. While On-site revenue continues to grow at impressive double-digit rates, branch revenue is lagging, growing in low single digits and contracting by 2.1% in 2023. This disparity highlights the importance of continued innovation and optimization across all revenue channels to maintain momentum.
The graph highlights the divergence in growth trends between Fastenal’s Onsite and Branch revenue segments. Onsite revenue has shown consistent and impressive growth, with peaks such as a 40.4% increase in 2018 and sustained strong performance in subsequent years. In contrast, Branch revenue is lagging, with annual growth often hovering in low single digits or even showing contraction, such as the -2% decline in 2020 and -2.1% in 2023.
This stark contrast underscores a significant shift in Fastenal's business dynamics. While Onsite revenue continues to scale rapidly, driven by tailored inventory solutions and proximity to customers, the branch segment struggles to keep pace, reflecting stagnation in traditional distribution models. The disparity is a critical indicator of Fastenal’s strategic focus on expanding Onsite operations while its legacy branch network faces headwinds.
I dove into the earning calls of Fastenal and found the following in response to the struggling branch segment:
Q3 2024 Earnings Call:
Dan Florness mentioned that business in the Eastern US has grown by about 5% recently, while business in the Western US is slightly negative. The Eastern US has adjusted to changes faster, while the Western US still faces lingering effects. He expects the branch side of the business to improve as they align better with the national accounts group and customer service consultants in the Western regions
Q2 2024 Earnings Call:
The performance of branches was affected by external factors, such as a hurricane in the Houston area, causing power outages and operational challenges. Despite these conditions, Fastenal employees continued to serve their top customers
So, there are most definitely headwinds in Fastenal's branch segment. This is good for Fastenal, as these headwinds seem temporary and should be resolved quickly. I found no further issues that could impact the long-term aspect of the branch segment. Let's hope this stays this way.
Overall, I am positive that there is more diversification, but at what cost? Fastenal's onsite revenue segment is growing at impressive rates, but its traditional branch segment is taking extreme heat. Is this something we should worry about? No. But this is most definitely worth keeping track of for shareholders.
2. Executive Leadership
2.1 CEO Experience
With over 28 years of experience at Fastenal, the current President and Chief Executive Officer has been leading the company since January 2016, overseeing operations and driving strategic growth for over nine years. Before this role, the Executive VP and Chief Financial Officer position was held from June 1996 to December 2015, a nearly 20-year tenure focused on financial strategy and operational excellence.
Before joining Fastenal, Daniel Florness had a career at KPMG LLP spanning over nine years, from 1987 to 1996, including serving as Senior Manager. This role involved auditing and providing essential services to Manufacturing, Retail, and Distribution firms within the Greater Minneapolis-St. Paul Area. Additional responsibilities in 1992–1993 in Montvale, NJ, included developing and delivering training programs.
A Bachelor of Science in Accounting earned from the University of Wisconsin-River Falls in 1986.
2.2 Employee Satisfaction Ratings
Fastenal scores well on the reviews on Glassdoor, which tells me that working there could be a pleasant endeavor for employees. As many of you know, I am a fan of a good company culture. I am convinced that a good culture drives good returns for the business. Having fewer roulettes with employees and management should create close ties with employees and drive value for the business and its shareholders.
Also, on Comparably, the CEO Daniel Flores scores exceptionally well!
Regarding diversity, happiness, future outlook, perks and benefits, compensation, and gender, there seems to be some leakage. Employees do approve of the CEO, but their perks could be better. In the industry of Fastenal, this is a common reoccurrence for employees. You could argue that this is the nature of the beast. I do hope to see improvement here. Why? A good culture drives a business to success, and an awful culture drives a business into the grounds. I would argue that this is not awful, but there are some major points for improvement if I have to believe the reviews of the employees.
I argued the same in my previous article on Hims and Hers. Culture is extremely important to any business aspiring to dominate the industry, and that should be the goal of every company.
2.3 CEO Value Creation
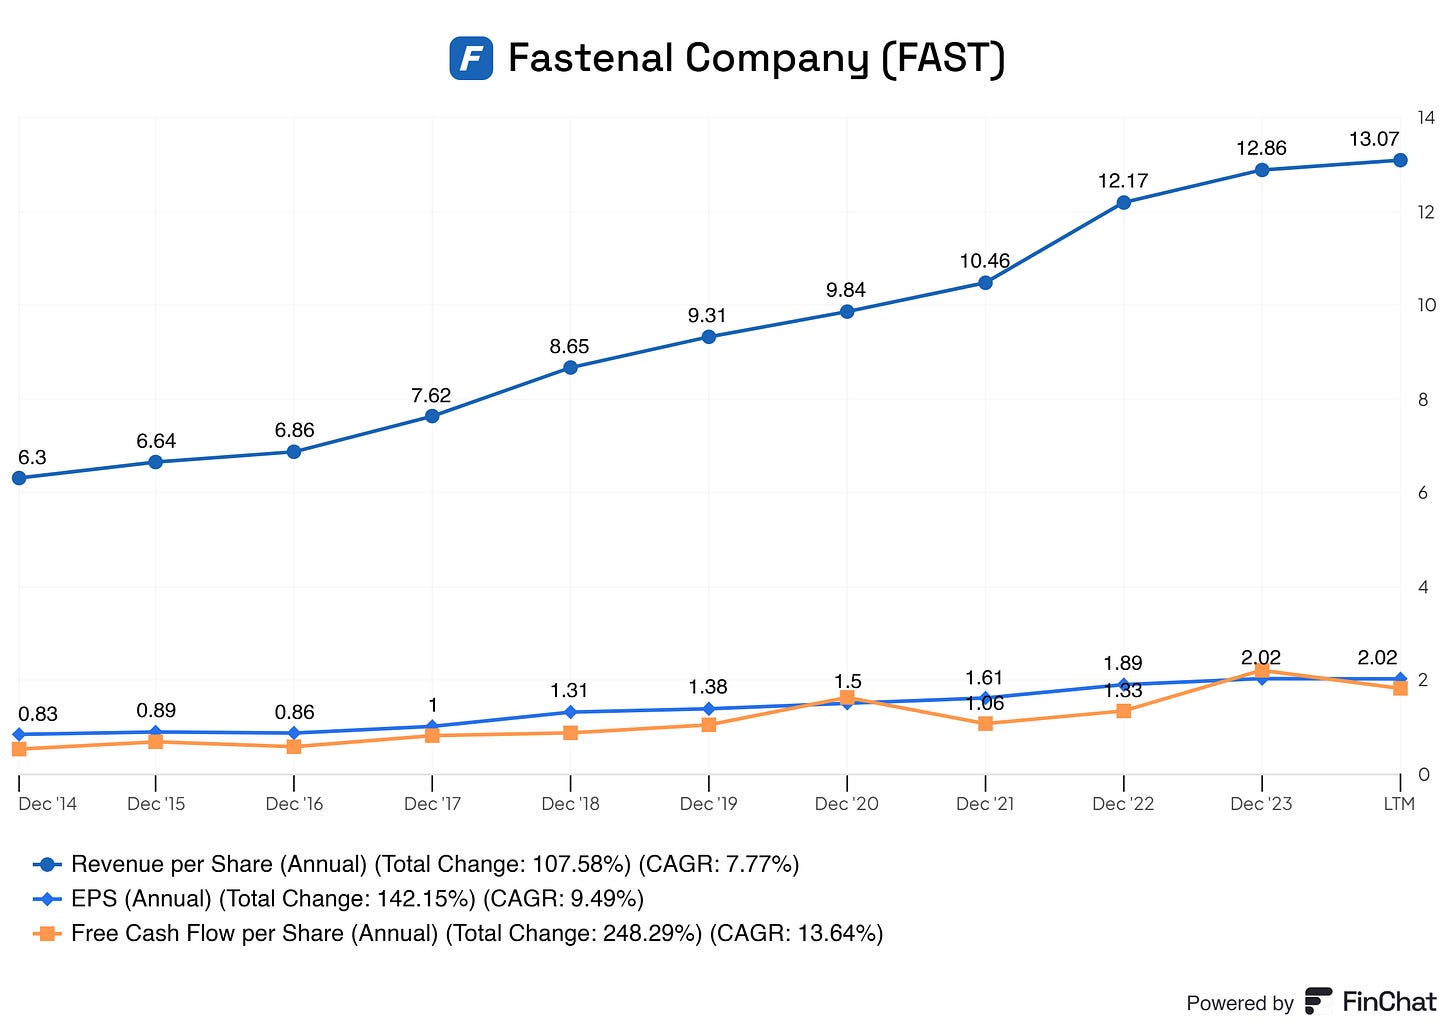
Yes, Daniel Florness is creating heaps of value for the business! We’re seeing a steady increase year-over-year in Fastenal’s EPS, revenue per share, and free cash flow per share. Yes, there are some hiccups along the way, and this is to be expected for every business. The primary concern is whether the trajectory is upward or downward. It’s up!
3. Inside- and institutional ownership
To me, inside ownership is crucial to a business. Having skin in the game tells us that management is most likely motivated by the same incentives as investors. The insensitive are growing the business and creating more value. Why? Because management will benefit greatly from their business and stock increasing in value.
Insiders do own a lovely portion of the business—4.63%, to be precise! I love businesses that have 3% or higher inside ownership.
Again, skin in the game!
Inside ownership is distributed the way I like it. The CEO, Daniel Florness, holds roughly 50% of the insider stocks! This means that Daniel Florness's insensitive should line up with those of its shareholders. If shareholders lose, so does Daniel Florness. If shareholders win, so does Daniel Florness!
Inside ownership has been decreasing since 2006, but insider ownership seems to be staying stable at its current level. This trend should keep up. I would love to see stable inside ownership or a slight increase to show its trust in the business.
The same goes for institutional ownership
Institutions have started loving Fastenal since 2018/2019. Since then, they have kept their positions stable, and in the last couple of years, we have seen year-over-year increases in institutional ownership.
Of course, do not take these statistics lightly! Inside and institutional ownership only tells half a story. Before ownership tells a complete story, the business needs to have solid metrics, good growth, solid management, and much more.
People can buy broken businesses, look the the complete picture.
4. Competitive and Sustainable Advantage (MOAT)
The MOAT for Him and Hers is tricky, but let's try it, shall we?
So, a MOAT can be in either one or more of the following forms:
Brand Power
Patents
Scale and Cost Advantages
Switching Costs
Network Effect
Attracting Talent (I consider this a MOAT, others don’t. Decide for yourself)
Fastenal, a leading industrial supply company, has established a robust competitive position through several key advantages:
Brand Power
Since its founding in 1967, Fastenal has built a strong reputation for quality and reliability in the industrial supply sector. Its commitment to customer service and extensive product selection has fostered trust and loyalty among a diverse customer base.
Patents
Fastenal holds approximately 150 active patents covering proprietary products and technologies as of September 30, 2024. These patents include innovations such as automated inventory replenishment systems, which utilize level sensors in storage bins to monitor stock levels and generate alerts when replenishment is needed. While these patents contribute to Fastenal's operational efficiency and service offerings, they are not the primary source of its competitive advantage. The industrial supply industry is characterized by rapid technological advancements and intense competition, with many companies developing similar solutions. For instance, competitors like Amazon Business have obtained patents for advanced delivery systems, such as drone-based technologies, posing significant challenges to traditional distributors.
Therefore, while Fastenal's patents support its business operations, they do not constitute a substantial moat. Other factors, such as its extensive distribution network, strong customer relationships, and integrated service offerings, more robustly support the company's competitive edge.
Scale and Cost Advantages
Operating over 3,000 branches across North America, Fastenal leverages its extensive network to achieve significant economies of scale. This expansive presence enables the company to negotiate favorable terms with suppliers, resulting in cost advantages passed on to customers. Additionally, Fastenal's vertically integrated supply chain—including manufacturing facilities, a fleet of over 6,000 vehicles, and multiple distribution centers—enhances operational efficiency and reduces reliance on external logistics providers.
Switching Costs
Fastenal's integrated solutions, such as on-site services and industrial vending machines, embed the company deeply within customers' operations. These tailored services create high switching costs as customers rely on Fastenal's systems for efficient inventory management and supply chain operations, making transitions to competitors complex and costly.
Network Effect
The company's extensive branch network and on-site services foster strong customer relationships, enhancing its value proposition and creating a network effect that attracts more clients.
Attracting Talent
While Fastenal has historically prioritized a strong company culture and internal development, it faces growing challenges in attracting top-tier talent. The industrial supply sector does not inherently appeal to younger professionals or tech-savvy workers seeking innovation-driven industries. Additionally, the company’s decentralized structure and reliance on a more traditional business model may not align with the preferences of modern talent looking for cutting-edge or flexible work environments. As a result, retaining high-performing employees and recruiting outside experts could become a bottleneck for growth in the long term.
5. Industry Analysis
5.1 Current Industry Landscape and Growth Prospects
The global supply chain management (SCM) industry is undergoing rapid growth, driven by increased demand for integrated solutions and rising awareness of the benefits of supply chain optimization. Valued at USD 23,265.4 million in 2023, the market is projected to grow at a compound annual growth rate (CAGR) of 11.2% from 2024 to 2030, fueled by advancements in technology, increased reliance on data-driven decision-making, and the need for supply chain resilience in a post-COVID-19 world.
Demand Drivers for SCM Solutions
Efficiency and Optimization Needs: Organizations are adopting SCM software to streamline operations, from sourcing raw materials to delivering finished goods. Enhanced capabilities in transportation management, inventory tracking, and demand planning are pivotal in meeting the growing complexity of global supply chains.
Technology Integration: The adoption of industrial-grade digital technology, including cloud-based platforms and AI-driven analytics, transforms supply chain operations. These innovations provide companies with greater visibility and control, enabling strategic decision-making.
Post-Pandemic Supply Chain Resilience: The disruptions caused by COVID-19 highlighted vulnerabilities in supply chains, prompting companies to invest heavily in SCM solutions. Improved forecasting, waste minimization, and seamless integration of suppliers and carriers have become critical priorities.
Benefits of SCM Solutions Driving Market Growth
Strategic Decision-Making: SCM tools allow companies to analyze vast amounts of data to make better decisions, optimize return on investment, and enhance competitive positioning.
Comprehensive Management: SCM solutions empower organizations to operate more efficiently and strategically by tracking inventory, managing order entries, coordinating distribution channels, and synthesizing financial information.
Cost Reduction and Sustainability: SCM software helps minimize waste and optimize resource allocation, supporting sustainability initiatives while driving cost efficiency. These benefits align with growing corporate and consumer focus on environmentally responsible operations.
Technology and Deployment Trends
Cloud-Based Solutions: The shift to cloud-based SCM platforms enables greater scalability, flexibility, and real-time collaboration among supply chain partners. This trend is particularly significant in addressing the demand for increased supply chain visibility.
Advanced Analytics and AI: Predictive analytics, machine learning, and AI are becoming integral to SCM solutions. These technologies improve forecasting accuracy, inventory management, and demand planning by providing actionable insights and enhancing operational efficiency.
Digital Transformation: The digital revolution reshapes supply chain management by integrating blockchain, IoT devices, and automation. These tools enhance transparency, reduce fraud, and improve overall system performance.
Key Challenges to Industry Growth
Infrastructure Gaps in Developing Regions: Limited IT infrastructure in emerging markets hinders the adoption of advanced SCM solutions. Many organizations face challenges in integrating sophisticated systems into their existing operations.
Security and Privacy Concerns: As SCM systems increasingly rely on digital technologies and cloud platforms, data security and privacy concerns present significant barriers to adoption.
Regional Growth Focus
North America: The largest market for SCM solutions, driven by strong technology adoption and the need for advanced supply chain analytics. Companies in the U.S. are heavily investing in digital SCM platforms to remain competitive.
Europe: Growth is supported by increasing emphasis on sustainability and regulatory compliance in supply chain operations. The region is also witnessing rapid adoption of cloud-based SCM solutions.
Asia-Pacific: The fastest-growing region, driven by expanding manufacturing industries, rising e-commerce adoption, and increasing demand for supply chain visibility. Governments like China and India are investing in digital infrastructure to support SCM advancements.
Key Industry Trends and Growth Drivers
Enhanced Supply Chain Visibility: The need for real-time tracking and integration across the supply chain drives innovation in visibility tools, allowing companies to respond quickly to disruptions and optimize performance.
Focus on Sustainability: Growing environmental awareness prompts organizations to adopt SCM solutions that minimize waste, reduce emissions, and optimize resource use.
Adoption of Subscription Models: Subscription-based pricing for SCM software is gaining traction, offering affordability and flexibility for businesses of all sizes.
Strategic Partnerships: Collaborations between technology providers and supply chain organizations are accelerating the development and deployment of next-generation SCM tools.
By addressing these challenges and leveraging technological advancements, the SCM industry is poised for significant growth, helping organizations improve efficiency, strengthen resilience, and achieve long-term sustainability.
5.2 Competitive Landscape
In 2024, an analysis of industrial supply companies—Fastenal (FAST), Grainger (GWW), United Rentals (URI), Ferguson (FERG), and others—shows diverse performance across growth, profitability, and efficiency metrics.
Revenue Growth
Fastenal's 3-year revenue CAGR stands at 8.62%, slightly below GWW's 10.34% and well behind URI’s 17.56%. This shows a moderate growth rate compared to its faster-growing peers. However, it remains competitive against companies like WSO (8.03%) and AIT (9.87%). This indicates steady but less aggressive revenue growth.
Profitability Metrics
Fastenal outshines many competitors in gross profit margin, boasting an impressive 45.23%, surpassing GWW (39.25%) and URI (41.02%). This reflects strong pricing power and cost management. However, Ferguson and SITE lag considerably with gross margins of 30.55% and 34.48%, respectively.
Regarding operating margin, Fastenal leads at 20.31%, significantly outperforming GWW (15.39%) and URI (27.49%). This highlights superior operational efficiency.
Return Metrics
Fastenal’s 5-year ROIC average of 28.84% is a standout, leading the pack and showcasing its exceptional capital efficiency. By comparison, URI's ROIC is modest at 11.15%, and WCC stands at just 15%.
EPS Growth
Fastenal’s diluted EPS 3-year CAGR of 9.43% reflects a steady growth trajectory but lags behind high-performing competitors like URI (32.26%) and CNM (43.56%). However, it comfortably surpasses WSO (9.39%) and AIT (23.31%), indicating reliable profitability improvements.
For the forward 2-year EPS CAGR, Fastenal shows a moderate 4.27%, which trails URI’s 7.3% but demonstrates stability compared to negative performers such as CNM (-2.74%) and SITE (-18.52%).
Market Strengths and Weaknesses
Fastenal excels in profitability and capital efficiency. Its industry-leading gross profit margins (45.23%) and standout ROIC 5-year average (28.84%) highlight its robust ability to generate returns from investments. Its operational efficiency, demonstrated by a high operating margin (20.31%), sets it apart from many competitors.
However, regarding revenue and EPS growth, Fastenal is outpaced by high-growth companies like URI and CNM. While its growth is steady, it lacks aggressive expansion, which is evident in these peers.
6. Risk Assessment
Economic Sensitivity (4/5)
Fastenal operates in the industrial supply sector, which is highly cyclical and sensitive to economic conditions. A manufacturing, construction, or industrial activity slowdown could significantly impact demand for Fastenal’s products. While its diverse customer base across various industries provides some resilience, prolonged economic downturns remain a substantial risk.
Competition (3/5)
The industrial supply market is highly competitive, with major players like Grainger (GWW) and Ferguson (FERG) vying for market share. Additionally, e-commerce giants like Amazon Business pose a growing threat due to their scale, pricing power, and logistics capabilities. While Fastenal’s focus on high-margin services like vending machines and onsite solutions provides differentiation, maintaining its competitive edge will require constant innovation and investment.
Supplier and Inventory Risks (2/5)
Fastenal’s ability to maintain optimal inventory levels is critical to its success. Disruptions in the global supply chain, raw material shortages, or supplier insolvencies could lead to delays, increased costs, and loss of customer trust. However, Fastenal’s strong supplier relationships and inventory management systems mitigate these risks significantly.
Customer Concentration (2/5)
Fastenal’s diverse customer base reduces reliance on any single client. However, its largest customers contribute a significant portion of revenue, particularly in the manufacturing and construction sectors. The loss of a major client or reduced spending from key industries could adversely impact revenue.
Technological Disruption (4/5)
The industrial supply sector is undergoing rapid digital transformation. Competitors leveraging advanced technologies such as AI, blockchain, and automation may outpace Fastenal in supply chain optimization and customer engagement. While Fastenal actively invests in digital tools, falling behind in technological innovation poses a significant threat.
7. Financial Health
7.1 Assets Assessment
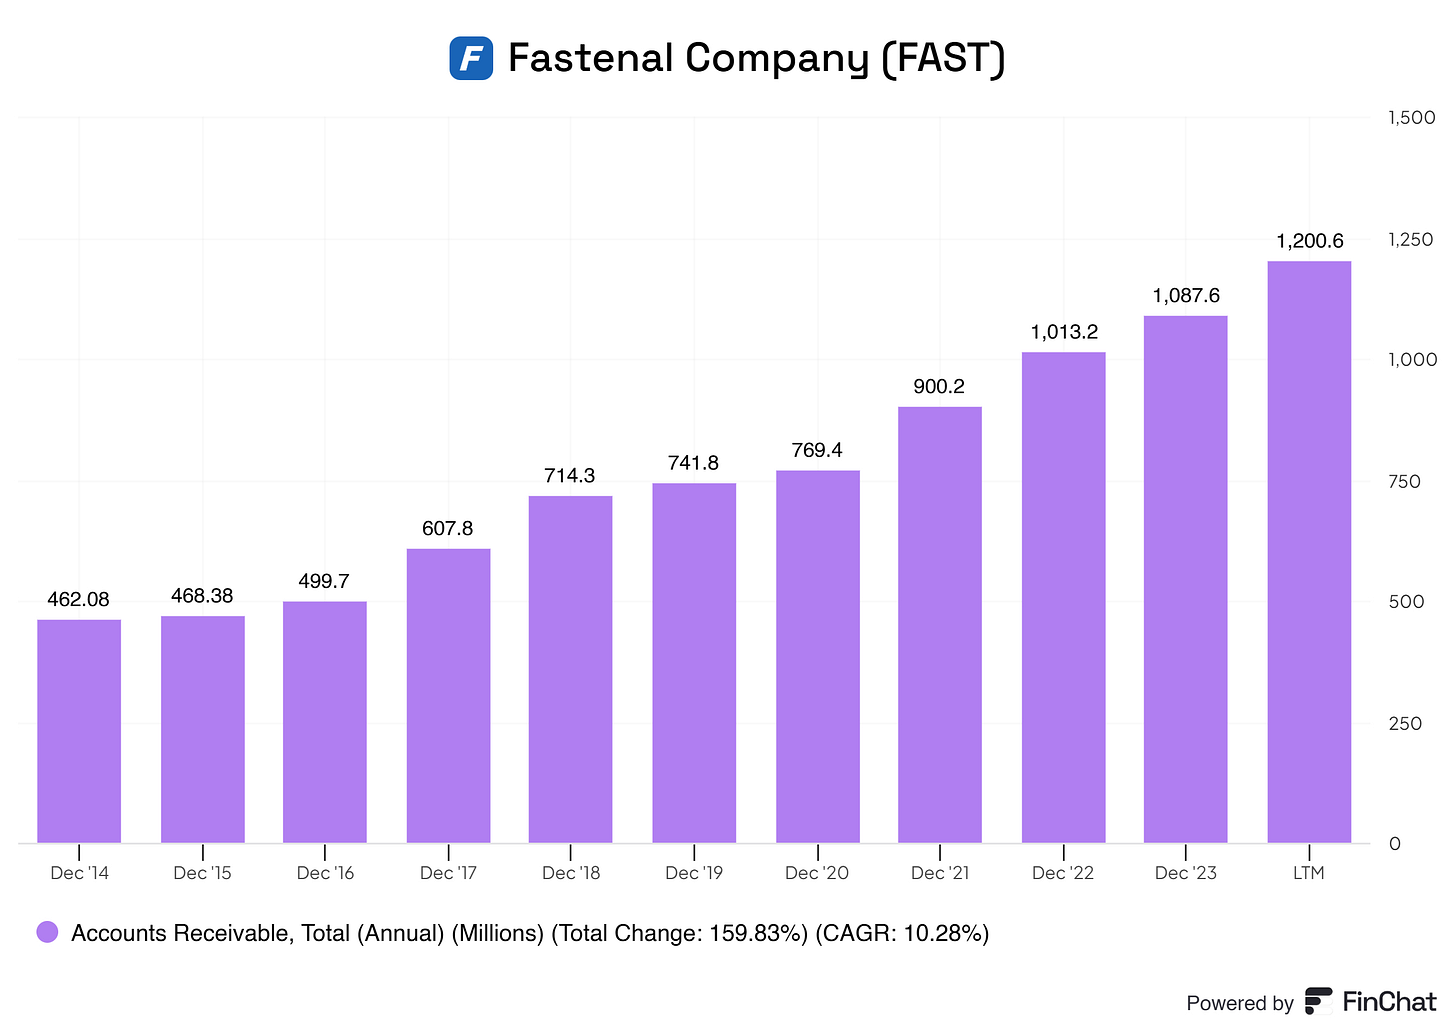
the AR (account receivables) for Fastenal is growing rapidly. If AR increases this signals that the company is generating higher sales on credit, which could indicate growing demand for its products and services. Also, Fastenal could be deliberately relaxed on credit terms to attract new customers or strengthen relationships with existing ones. This can be part of a growth strategy. We see that Fastenal is focused on growth, so therefore, I do think this is their strategy.
Fastenal's AR has grown substantially from $462 million in 2014 to $1.2 billion in the latest trailing period, reflecting a compound annual growth rate (CAGR) of 10.28%. This growth outpaces the company's revenue CAGR of 7.38% over the same period, indicating a higher reliance on credit sales. While increasing AR is not inherently problematic, it signals that cash collections may lag slightly behind revenue growth.
Revenues, Cash Collections, and Days Sales Outstanding Fastenal's annual revenues have consistently grown from $3.73 billion in 2014 to $7.48 billion in the LTM, showcasing the company’s ability to expand its top line. However, when we analyze cash collections using the formula:
For the most recent period:
Revenue (LTM): $7,480.1 million
AR Change (2023 to LTM): $1,200.6M – $1,087.6M = $113M
This implies that Fastenal’s estimated cash collections were approximately $7,367.1 million during the period, indicating a slight lag as more revenue is tied up in receivables.
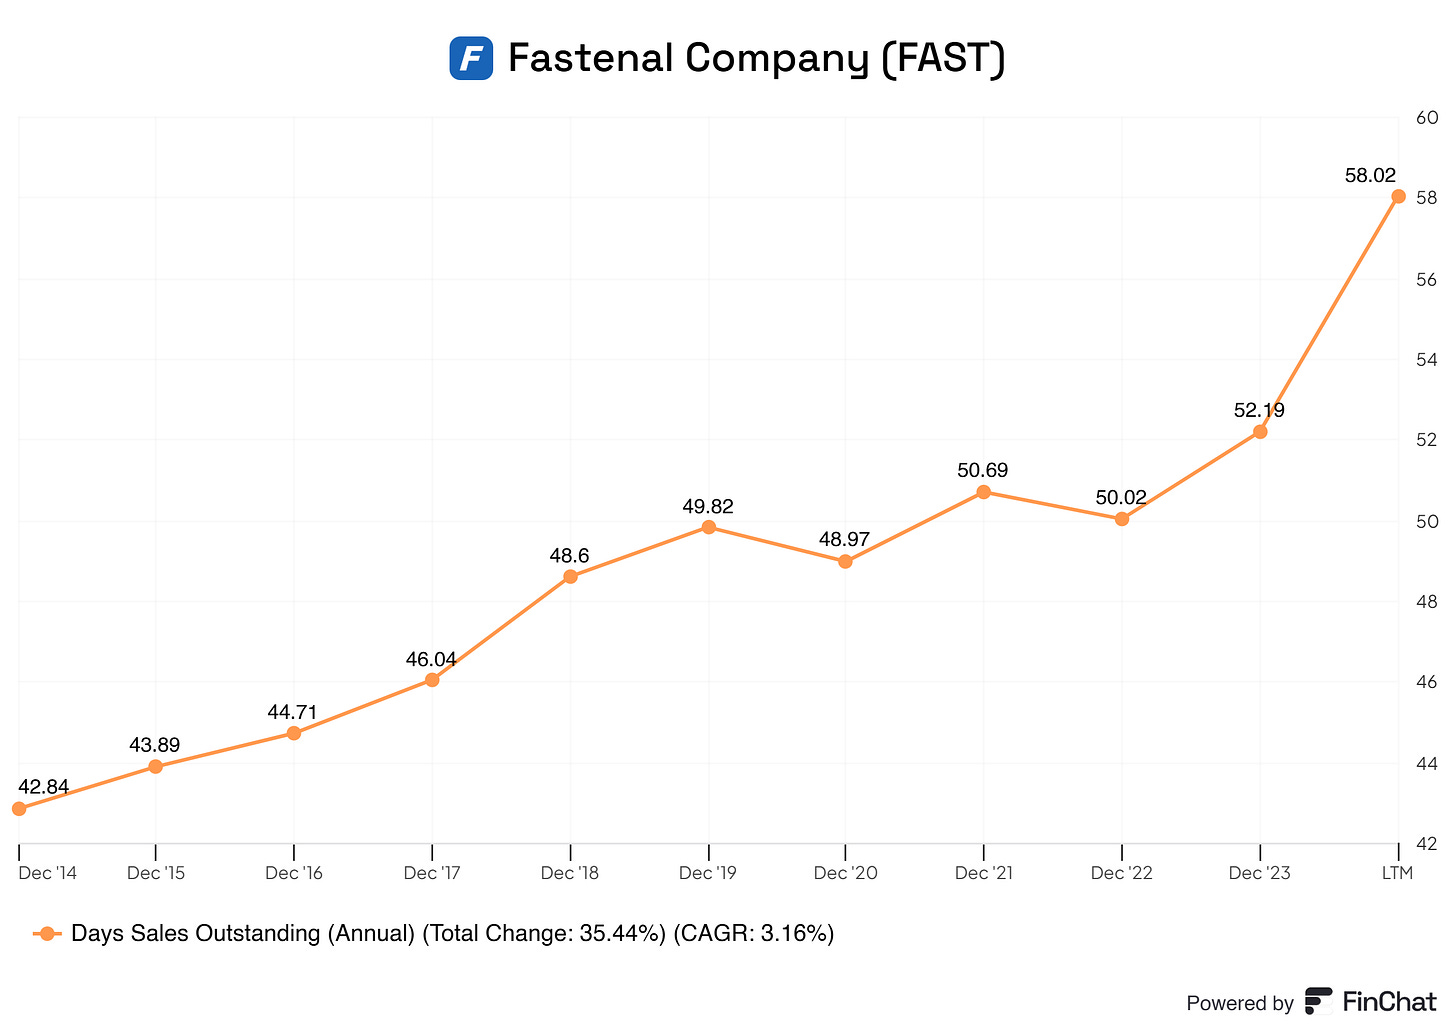
Days Sales Outstanding (DSO) The company's DSO has increased from 42.84 days in 2014 to 58.02 days in the LTM, reflecting a total growth of 35.44%. The rising DSO indicates that customers are taking longer to pay their invoices, contributing to the growth in AR. While this trend suggests lenient credit terms or slower collections, Fastenal’s ability to manage bad debts minimizes the financial risk.
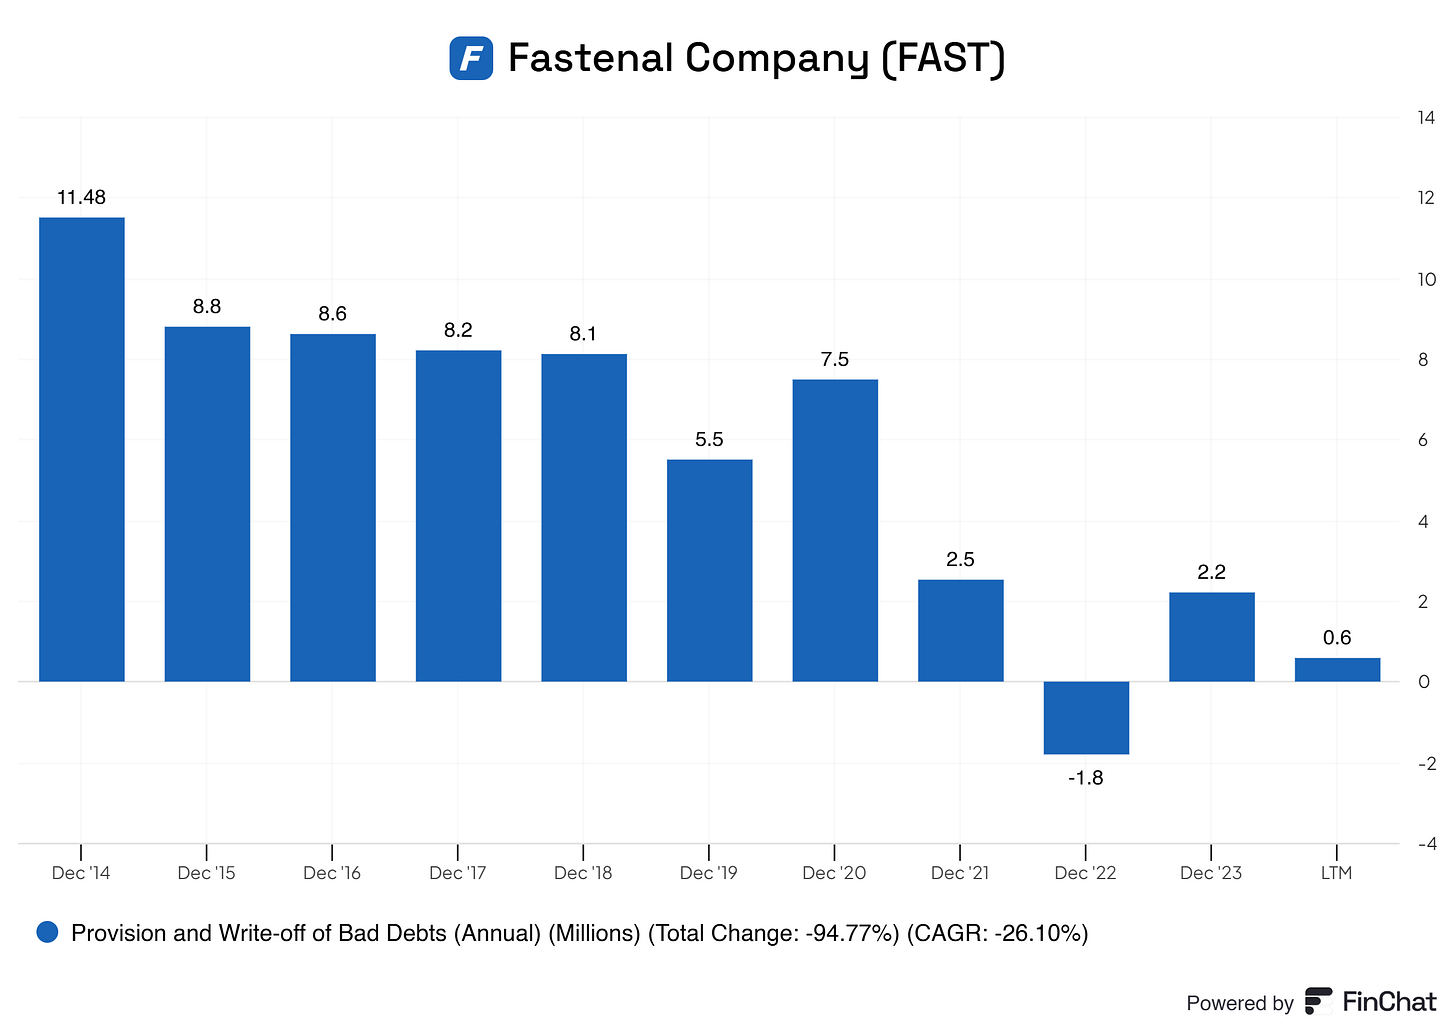
Provision and Write-offs of Bad Debt Fastenal’s provision and write-offs for bad debts have decreased significantly over the years, from $11.48 million in 2014 to just $0.6 million in the LTM. This dramatic reduction underscores the company’s strong credit management practices, ensuring its customers are reliable payers despite the rising AR.
AR Growth and Credit Sales: The steady rise in AR reflects Fastenal’s focus on credit sales as a driver of revenue growth, a common strategy in the B2B sector. However, the company must collect these receivables efficiently to prevent potential cash flow constraints.
Rising DSO: The upward trend in DSO highlights Fastenal's need to optimize its collections process. A longer DSO can strain cash flow, especially if AR growth continues to outpace revenue.
Strong Credit Quality: The significant reduction in bad debt write-offs highlights Fastenal’s disciplined approach to extending credit, ensuring minimal losses from unpaid accounts. This is a key strength that supports its financial health.
Lagging Cash Collections: While the AR increase slightly outpaces revenue growth, this indicates a potential lengthening of the company’s cash conversion cycle. Fastenal must monitor its DSO closely to ensure the timely collection of receivables.
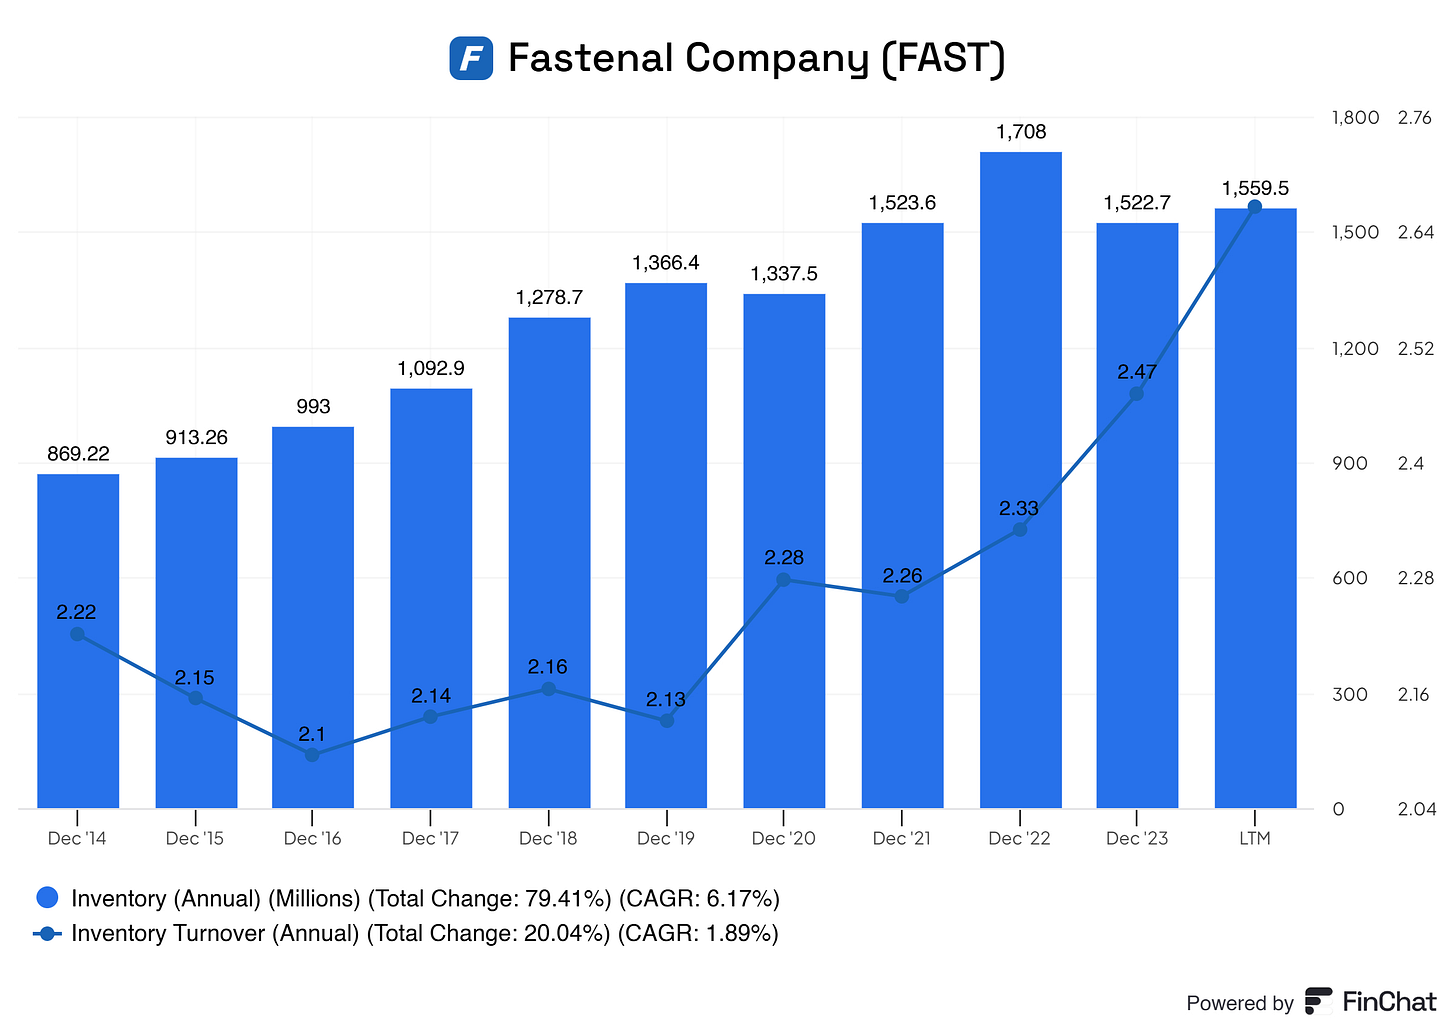
Another item is their inventory.
Inventory and Inventory Turnover Analysis Fastenal’s inventory levels have grown significantly, from $869.22 million in 2014 to $1,559.5 million in the LTM. This increase aligns with the company’s revenue growth and reflects its ability to scale inventory to meet customer demand. The inventory turnover ratio has also improved modestly, rising from 2.22 times in 2014 to 2.47 times in the LTM.
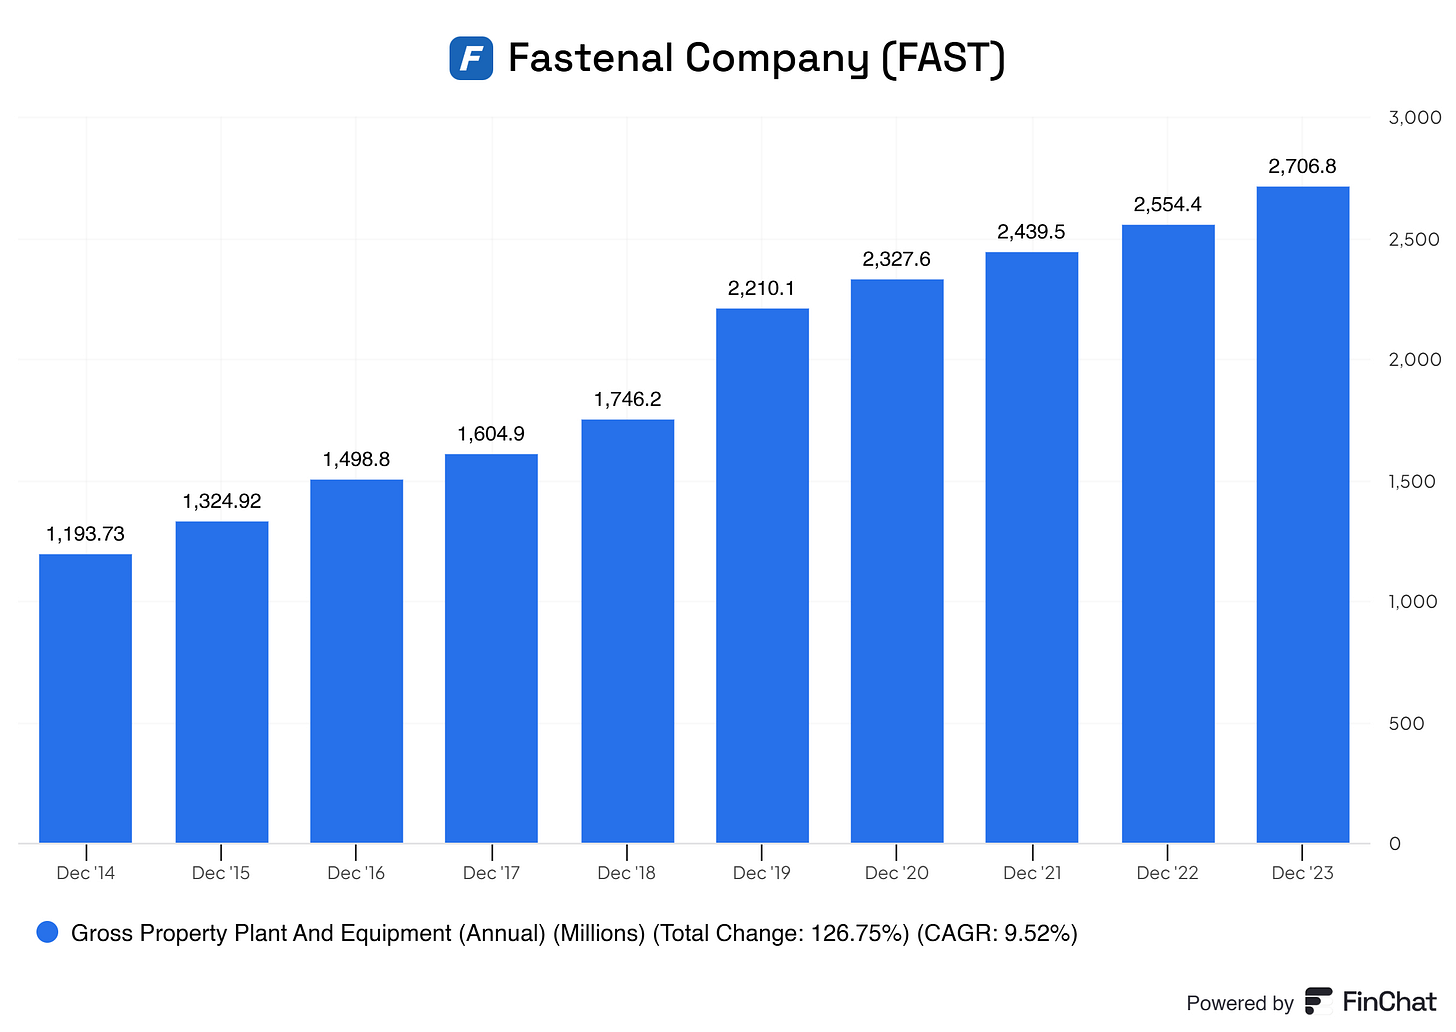
Fastenal's Gross Property, Plant, and Equipment (PPE) has grown from $1,193.73 million in 2014 to $2,706.8 million in 2023. This significant increase in PPE aligns well with the company’s revenue growth and operational expansion over the same period, underscoring its strategic investments to support scaling operations and meet growing customer demand.
Fastenal's revenue has grown from $3.73 billion in 2014 to $7.48 billion in 2023. The slightly higher growth in PPE indicates that the company has been proactively expanding its infrastructure to support long-term growth. This investment is necessary for a B2B environment where operational efficiency and service depend on physical facilities like distribution centers, vending solutions, and automated inventory systems.
The increase in PPE reflects Fastenal’s focus on expanding its physical footprint, including warehouses, distribution facilities, and on-site service offerings. This enables the company to stock more inventory, reduce lead times, and improve customer service. Key to Fastenal’s business model is its investment in infrastructure to support its FAST Solutions vending machines and on-site inventory management systems, which are capital-intensive yet critical to maintaining its competitive edge.
The consistent investment in PPE signals that Fastenal is growing revenue and positioning itself for future scalability. This aligns with the company's strategy to meet increased demand efficiently while maintaining superior customer service. The rise in PPE, along with steady improvements in inventory turnover and revenue per asset, indicates that Fastenal effectively utilizes these assets to generate revenue. This supports the company's ability to balance capital expenditures with operational efficiency. Fastenal’s PPE investments are a cornerstone of its differentiation strategy, enabling it to offer tailored supply chain solutions like vending machines and just-in-time inventory delivery. These capabilities are capital-intensive but essential for retaining and growing its market share.
7.2 Liabilities Assessment
On the liabilities, there’s nothing worth mentioning. Fastenal is decreasing its long-term debt, and overall, this side of the balance sheet is looking excellent! It's very healthy.
8. Capital Structure
8.1 Expense Analysis
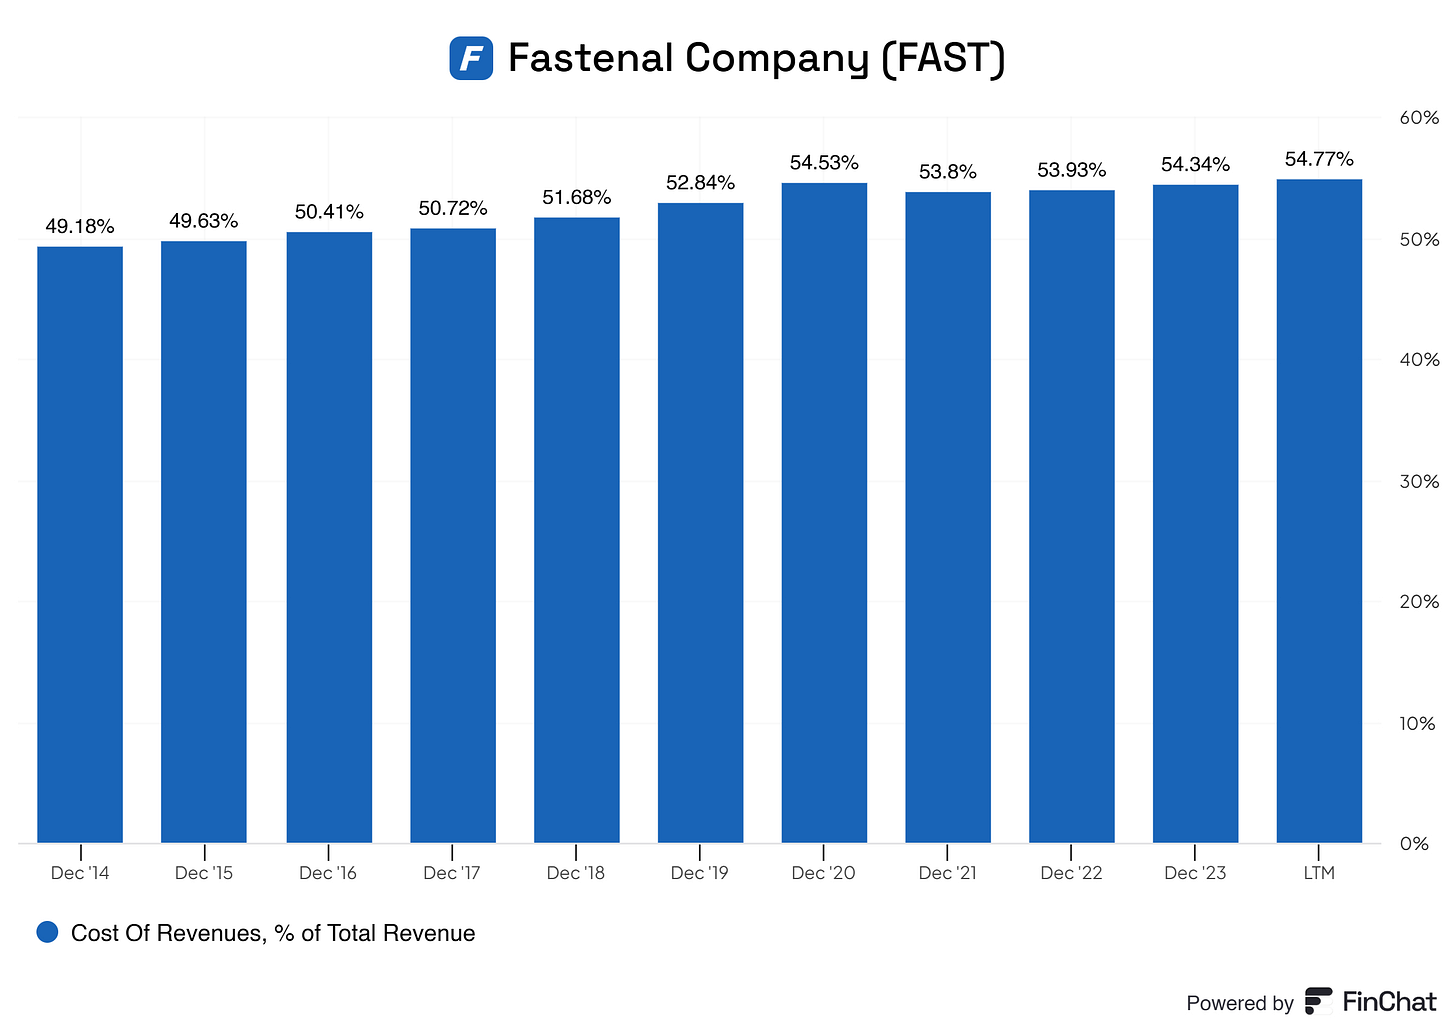
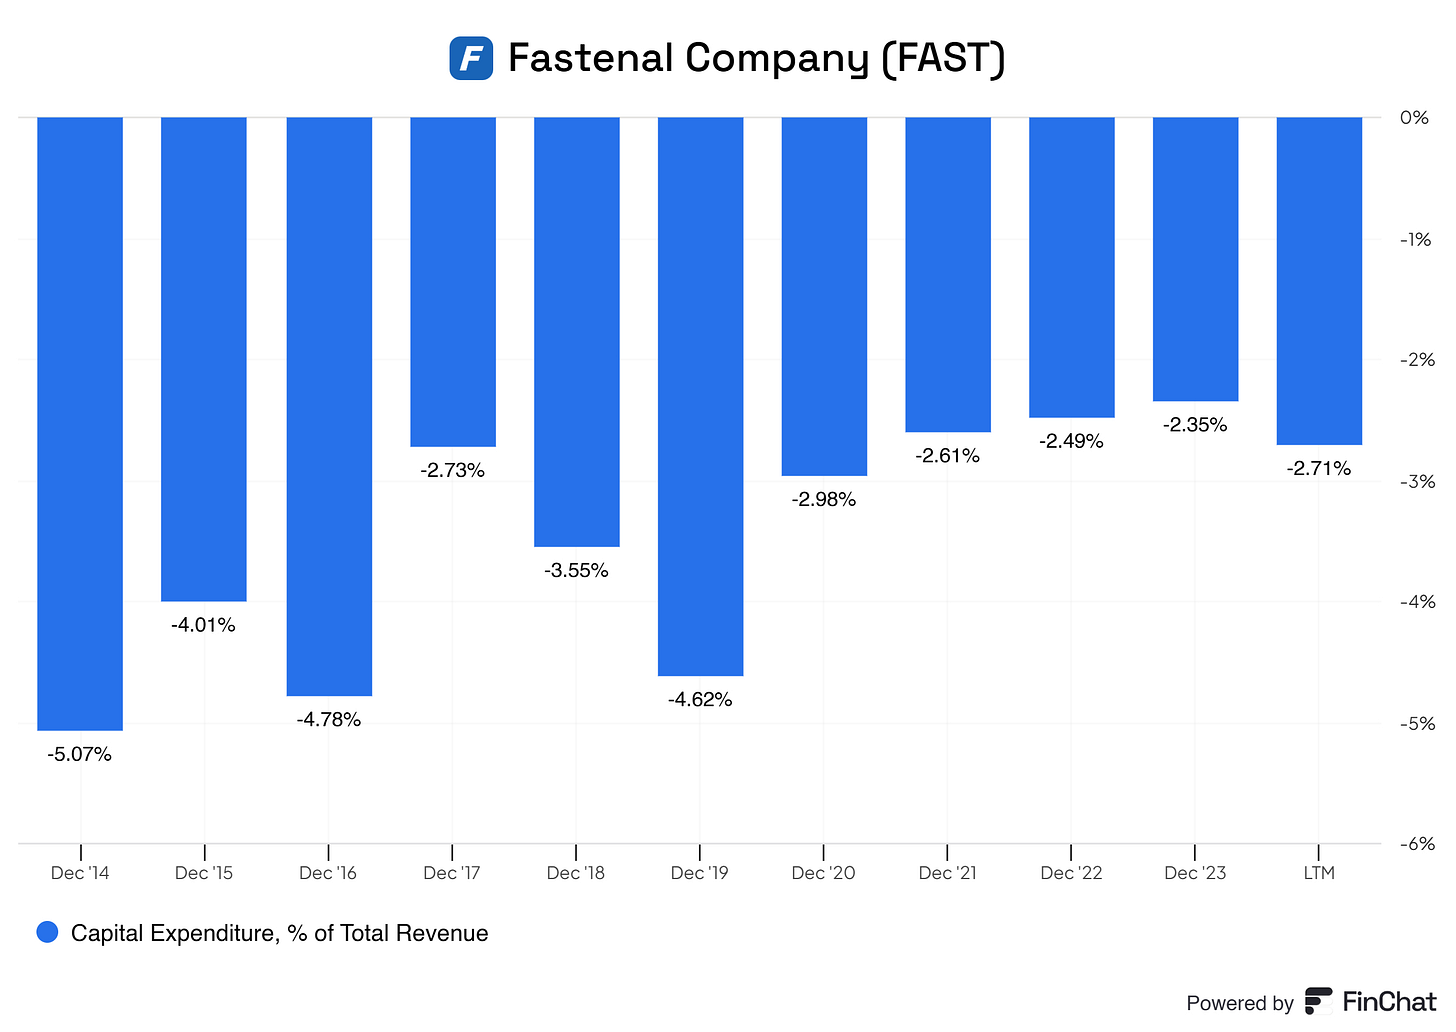
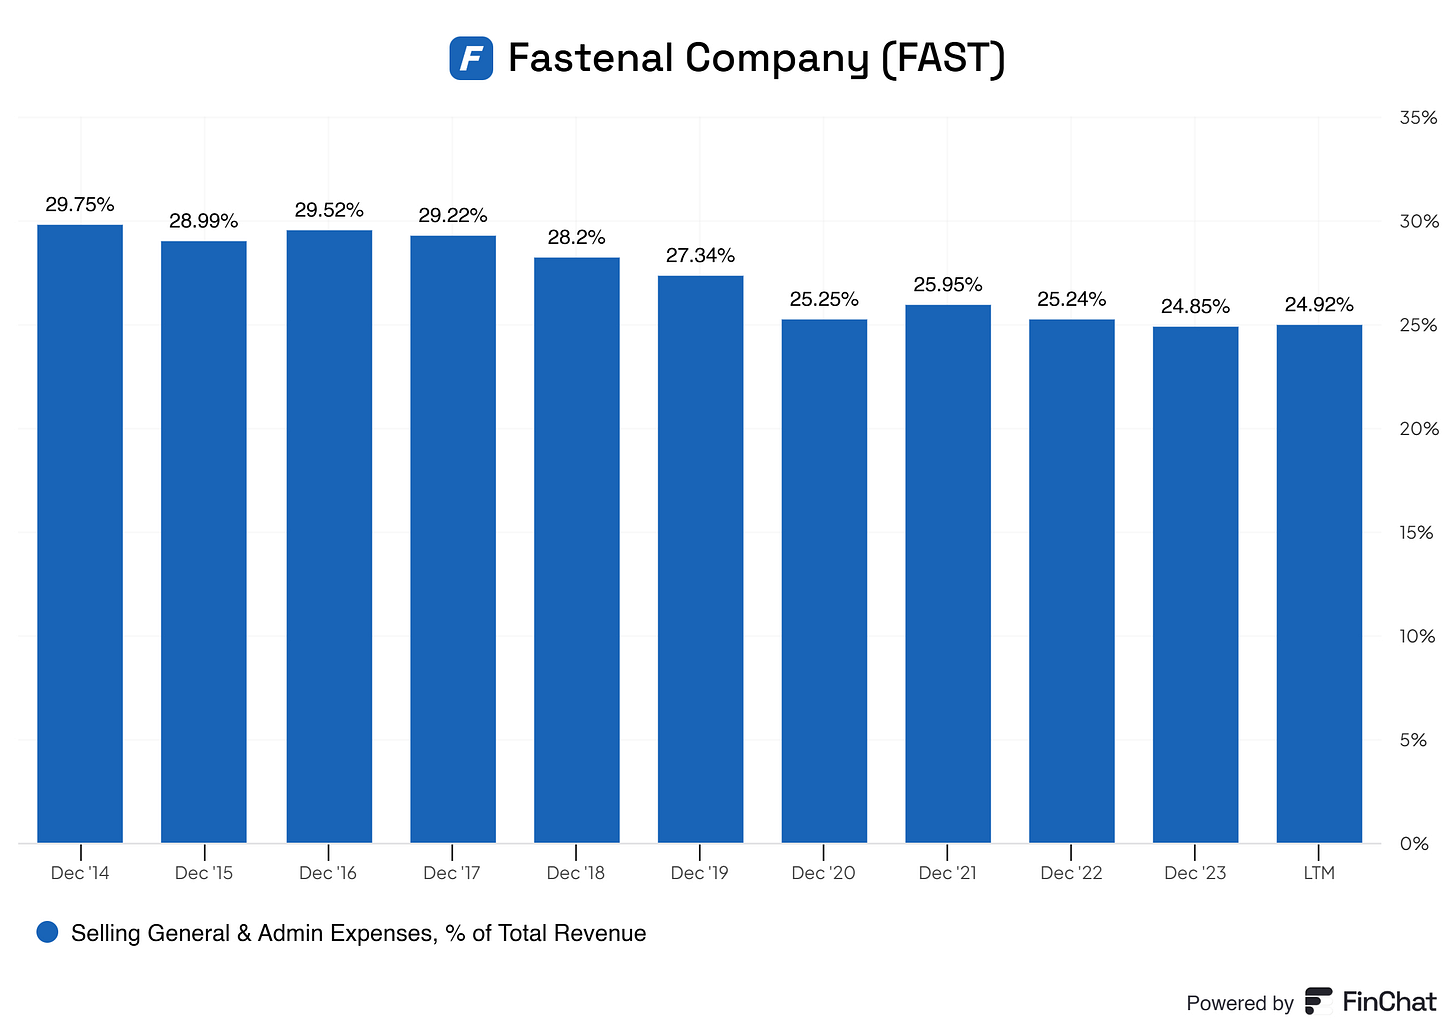
Fastenal’s expenses, including Cost of Revenue, Selling, General, and Administrative (SG&A) Expenses, and Capital Expenditures (CAPEX), provide a comprehensive view of its operational efficiency and growth strategy. These metrics demonstrate strengths in scaling operations while highlighting areas to monitor for improvement.
The cost of revenue steadily increased from 49.18% of total revenue in 2014 to 54.77% in the latest trailing period (LTM). This rise reflects a higher cost burden relative to revenue, which could be attributed to inflationary pressures, increased raw material costs, or higher operational expenses. While this upward trend signals tighter margins, it is common in the industrial supply sector, where competitive pricing and fluctuating supply chain costs play a significant role. To maintain its gross margins, Fastenal may need to optimize supply chain processes and leverage economies of scale.
Fastenal’s CAPEX as a percentage of revenue has decreased from 5.07% in 2014 to 2.71% in LTM. This declining trend suggests that the company has reached a more stable phase in its capital investment cycle, focusing on maintaining and incrementally improving its existing infrastructure rather than aggressively expanding. While this reduction frees up cash flow for other initiatives, it is crucial for Fastenal to ensure that reduced CAPEX does not lead to underinvestment in critical infrastructure that supports long-term growth.
Selling, General, and Administrative (SG&A) Expenses as a percentage of revenue have declined from 29.75% in 2014 to 24.92% in LTM, demonstrating improved cost efficiency. Despite absolute increases in SG&A expenses due to revenue growth, this proportional decline indicates that Fastenal has successfully scaled its operations while effectively managing administrative and selling costs. This indicates operational discipline and the company's ability to expand without disproportionately increasing overhead expenses.
What’s Good
Improved SG&A Efficiency: The decline in SG&A expenses as a percentage of revenue highlights Fastenal's ability to scale its operations efficiently. This trend supports the company’s profitability and operational resilience.
CAPEX Rationalization: Lower CAPEX relative to revenue indicates that Fastenal is leveraging its established infrastructure and focusing on efficient resource allocation.
Revenue Growth Alignment: Despite increases in absolute costs, the proportional management of SG&A ensures that expenses are not growing faster than revenue.
What’s Concerning
Rising Cost of Revenue: The steady increase in revenue relative to total revenue could erode gross margins over time. This warrants closer attention to procurement and supply chain strategies.
Potential for Overhead Pressure: While SG&A has improved, any unanticipated increases in administrative or selling costs could offset these gains.
Moving forward, Fastenal is likely to maintain its focus on operational efficiency and cost discipline. Continued improvements in SG&A efficiency and strategic CAPEX deployment will help the company sustain its profitability. However, addressing rising revenue costs will be critical to preserving margins and maintaining a competitive edge. Fastenal may need to optimize its supply chain further and explore pricing strategies to mitigate these pressures.
8.2 Capital Efficiency Review
This is just pure excellence here!
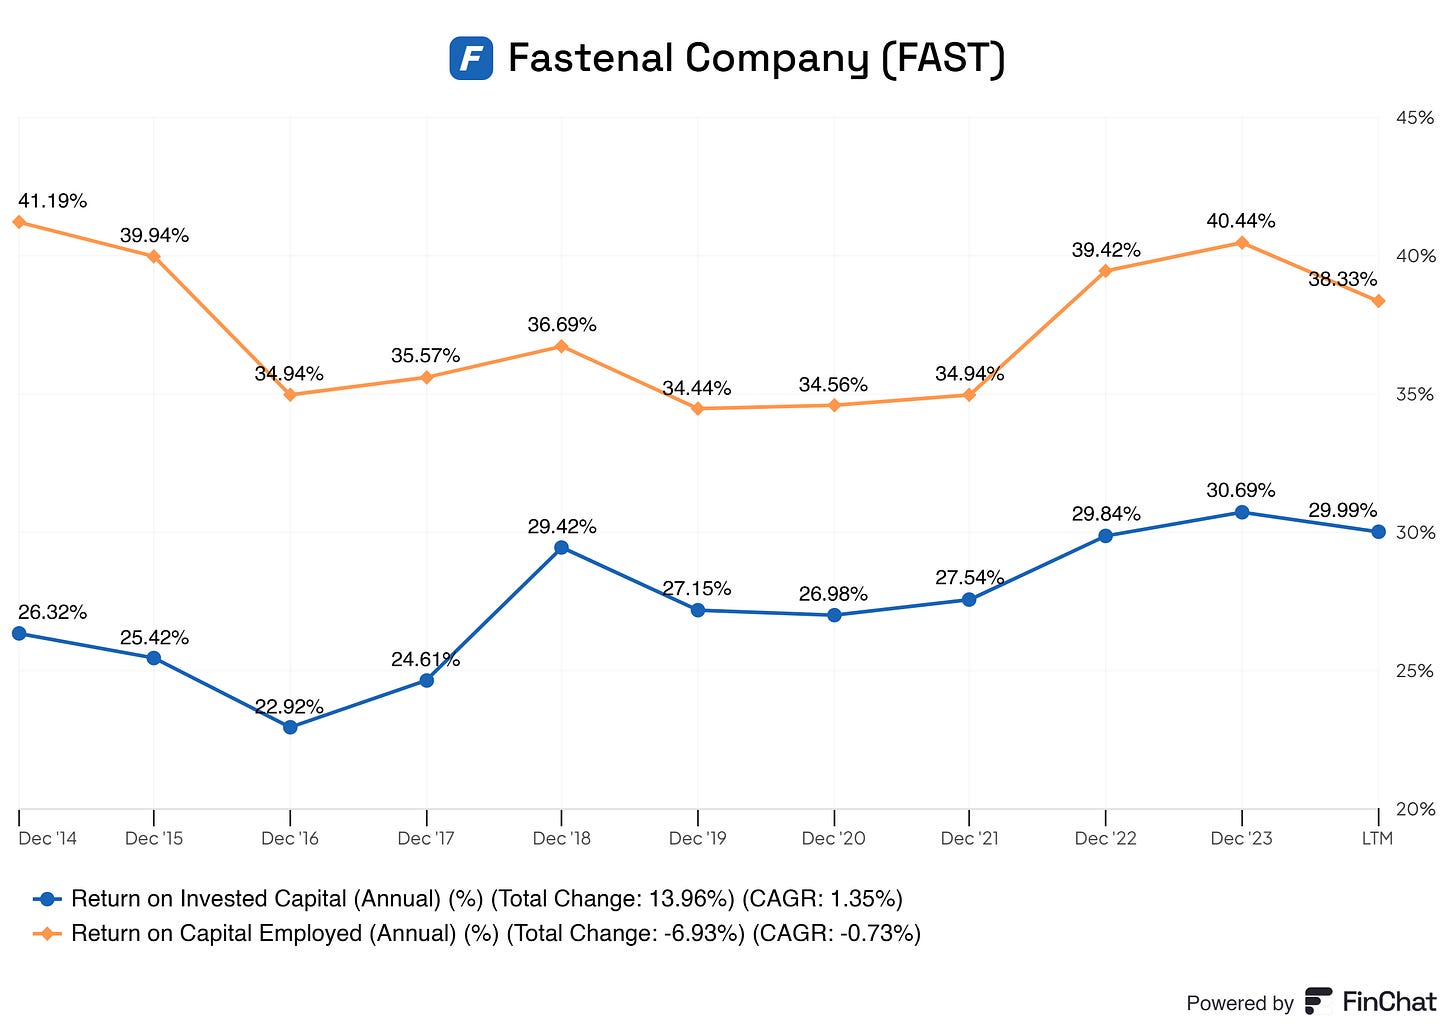
Fastenal’s capital efficiency metrics, particularly its Return on Invested Capital (ROIC) and Return on Capital Employed (ROCE), underscore its exceptional ability to generate returns from its investments and overall capital base. These metrics highlight the company’s operational excellence and demonstrate its commitment to delivering value for shareholders.
Fastenal’s ROIC has steadily improved over the years, increasing from 26.32% in 2014 to an impressive 29.99% in the latest trailing period (LTM), reflecting a total growth of 13.96% with a compound annual growth rate (CAGR) of 1.35%. This upward trajectory showcases the company’s ability to efficiently deploy its invested capital into high-return projects and operations, even amidst fluctuating economic conditions. The nearly 30% ROIC is a benchmark of superior performance in the industrial supply sector, where competitors often struggle to achieve such sustained profitability from their investments.
Fastenal’s ROCE remains remarkable, averaging above 35% in recent years and peaking at 40.44% in 2022 before slightly leveling off to 38.33% in LTM. While there has been a slight decline from the earlier 2014 level of 41.19%, the sustained high ROCE indicates exceptional efficiency in utilizing equity and debt to generate operating income. A ROCE consistently above 30% firmly places Fastenal among the elite performers in capital-intensive industries.
Fastenal’s impressive ROIC and ROCE are clear indicators of a company that knows how to manage its capital better than most. This efficiency level reflects a business model that prioritizes high returns on investments while maintaining strong operational discipline. Investors seeking a company that consistently generates shareholder value can find confidence in Fastenal’s exceptional capital efficiency track record.
In conclusion, Fastenal’s ROIC and ROCE metrics are not just good—they are a testament to its industry dominance and financial acumen. The company’s consistently delivering such stellar returns makes it a standout player in the industrial supply sector and a shining example of capital efficiency at its finest.
9. Profitability Assessment
9.1 Profitability, Sustainability, and Margins
Fastenal’s profitability metrics and margins tell a compelling story of a company that has not only scaled its operations but has also sustained impressive financial performance over the years. Despite minor fluctuations, its overall margins reflect remarkable stability and efficiency in a competitive market.
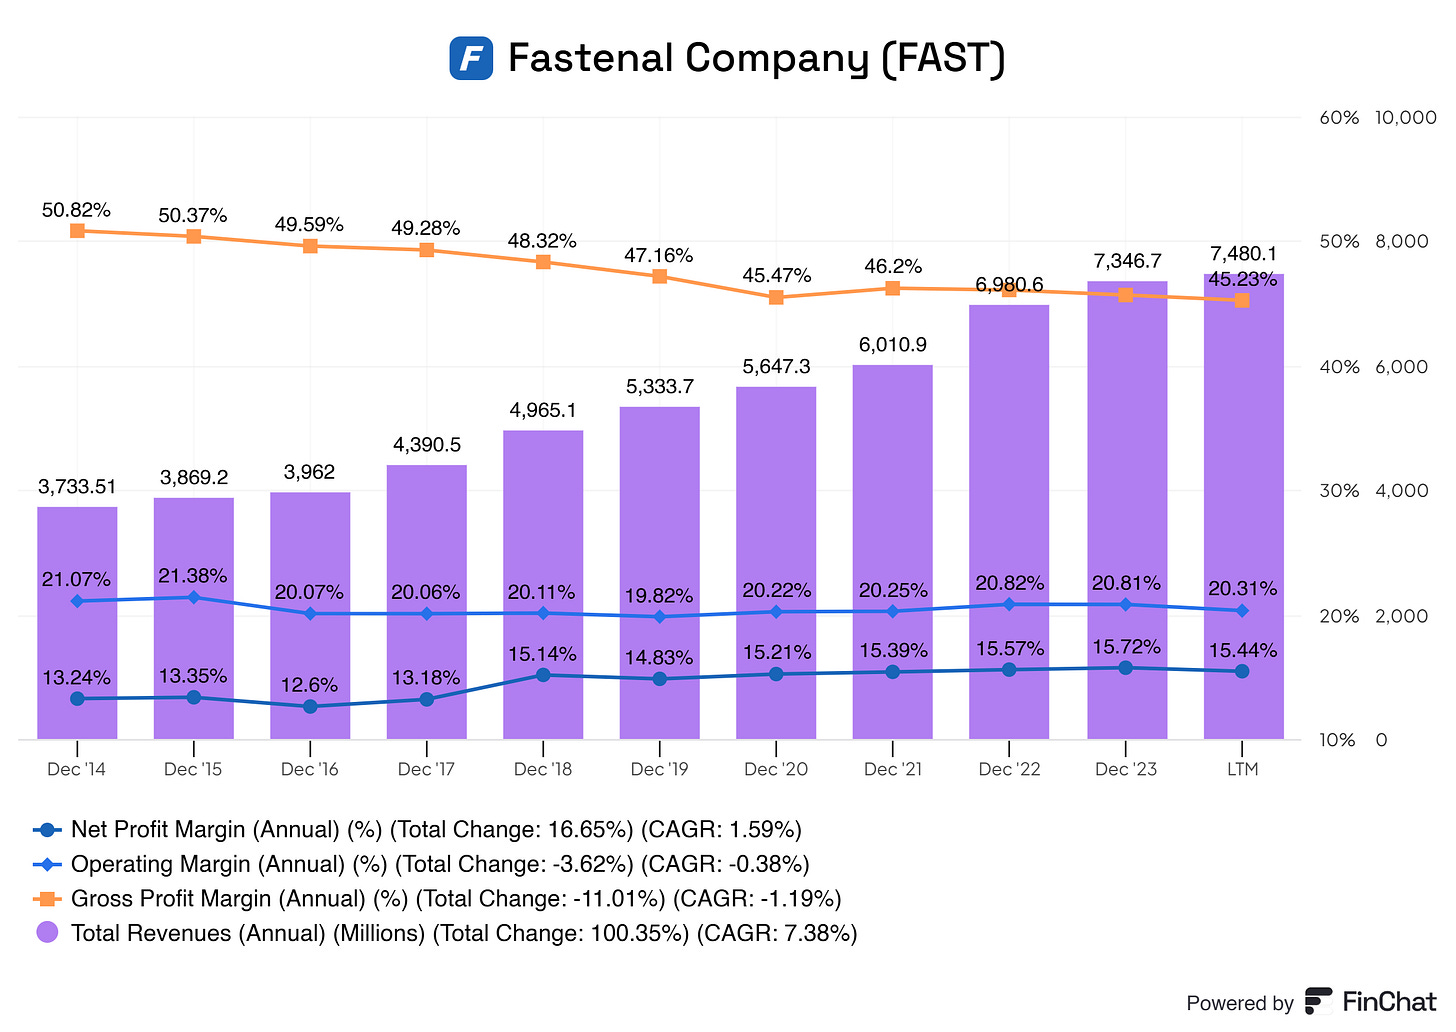
Fastenal’s total revenue has grown from $3.73 billion in 2014 to an impressive $7.48 billion in the latest trailing period (LTM), achieving a 100.35% total growth with a CAGR of 7.38%. This substantial growth has been accompanied by consistently strong profitability metrics, underscoring the company’s ability to scale effectively while maintaining robust margins.
The company’s net profit margin has improved from 13.24% in 2014 to 15.44% in LTM, marking a 16.65% total change. This steady increase demonstrates Fastenal’s ability to convert a growing portion of its revenue into actual profit, showcasing operational excellence and cost efficiency.
Fastenal’s operating margin has remained relatively stable, ranging between 19.82% and 20.82% over the last decade, finishing at 20.31% in LTM. Despite a slight decline of 3.62% over the period, this consistency highlights the company’s resilience in managing operational costs while scaling its revenue. Maintaining operating margins above 20% is a hallmark of exceptional efficiency in the industrial supply sector.
While gross profit margin has declined slightly from 50.82% in 2014 to 45.23% in LTM, this is still an excellent level for a company in the industrial supply industry. The decline, amounting to a total change of -11.01% with a CAGR of -1.19%, can be attributed to rising costs of goods sold driven by inflationary pressures and competitive pricing dynamics. However, the stability of gross margins in recent years demonstrates that Fastenal has effectively managed its supply chain and pricing strategies to offset these challenges.
The stability of Fastenal’s operating and net profit margins underscores the sustainability of its profitability. The company has consistently maintained its cost structure while scaling revenue, reflecting disciplined financial management and robust operational systems. Fastenal’s ability to sustain such margins over time, even amidst minor declines in gross profit margin, highlights the strength of its business model.
Exceptional Profitability: Maintaining net profit margins above 15% and operating margins above 20% is rare in the industrial supply industry, setting Fastenal apart as a highly efficient and profitable company.
Resilience in Gross Margin: Despite industry-wide challenges like rising input costs, Fastenal has stabilized its gross margins in recent years, reflecting adaptability and strong supply chain management.
Sustainable Performance: Fastenal’s long-term margin stability demonstrates that its profitability is not a temporary phenomenon but a result of its disciplined approach to growth and efficiency.
9.2 Cash Flow Analysis
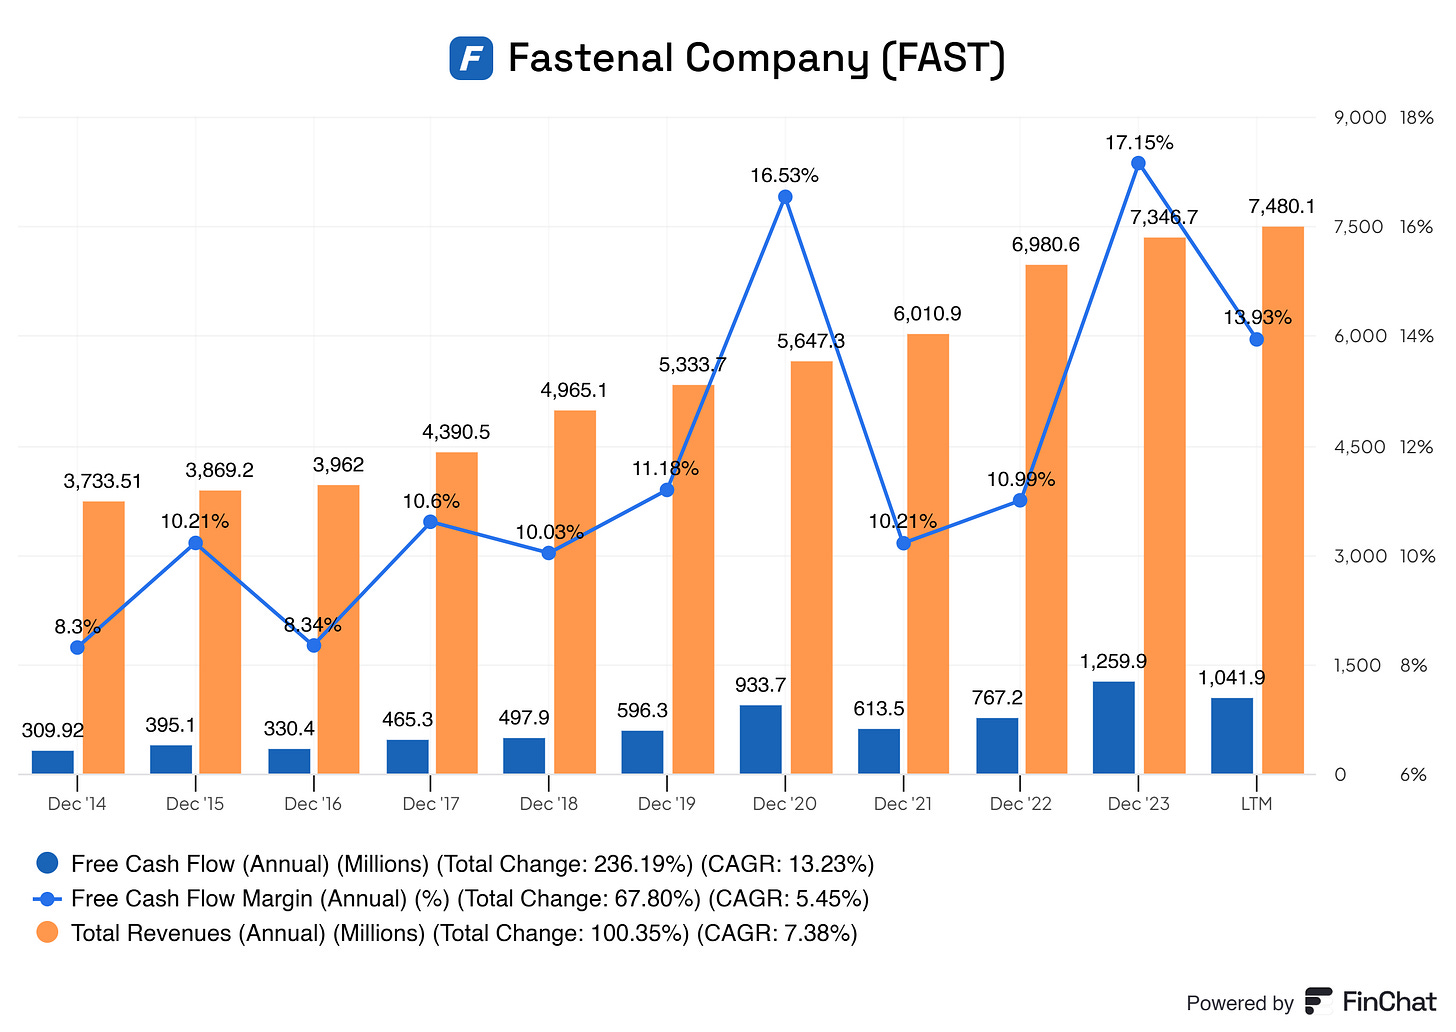
Fastenal’s ability to generate free cash flow (FCF) has grown significantly over the past decade, highlighting the company's financial health and operational efficiency. While its free cash flow margin indicates modest efficiency in converting revenue into cash, its consistent growth in absolute FCF demonstrates its resilience and robust cash-generating capabilities.
Fastenal’s annual free cash flow has grown from $309.92 million in 2014 to $1,041.9 million in the latest trailing period (LTM), representing a total change of 236.19% and a compound annual growth rate (CAGR) of 13.23%. This remarkable increase underscores the company’s ability to efficiently generate cash while scaling its operations.
The free cash flow margin has consistently improved, rising from 8.3% in 2014 to 13.93% in LTM. While this margin is modest compared to companies in less capital-intensive industries, it reflects steady progress in improving cash flow efficiency. Fastenal’s margin remains solid for its sector, where maintaining high working capital requirements and infrastructure investments can constrain cash conversion rates.
Fastenal’s revenue has grown by 100.35% over the same period, from $3.73 billion in 2014 to $7.48 billion in LTM. While the growth in free cash flow has outpaced revenue expansion, the relatively modest free cash flow margin suggests that the company operates within a sector where cash conversion from revenue faces inherent limitations due to ongoing investments in inventory, infrastructure, and customer-facing technologies.
Despite the significant progress, Fastenal’s free cash flow margin remains modest compared to its revenue size. This suggests that while the company is highly efficient operationally, further improvements in working capital management and cost optimization could unlock additional cash-generating potential.
10. Growth Analysis
Fastenal has demonstrated a strong growth trajectory over the years, supported by consistent revenue increases, disciplined expense management, capital efficiency, and robust free cash flow generation. Below is a comprehensive analysis of its growth metrics, profitability, sustainability, and forward-looking growth outlook.
Revenue Growth Projections
Next Year (2025): Based on Fastenal’s historical CAGR of 7.38%, the company is projected to achieve total revenue of approximately $8.03 billion in 2025, up from $7.48 billion in LTM. This steady growth aligns with Fastenal’s historical ability to expand its market share, driven by its strong customer relationships, innovative solutions like on-site inventory systems, and its extensive distribution network.
Following Years (2026-2028): As Fastenal continues to mature, revenue growth is expected to decelerate slightly, assuming a gradual reduction in growth rates to 6.5% in 2026, 6% in 2027, and 5.5% in 2028. Projected revenues could reach:
2026: $8.56 billion
2027: $9.08 billion
2028: $9.58 billion
This steady growth is underpinned by Fastenal’s operational scalability, infrastructure investments, and ability to deliver superior customer service through its automated inventory systems and B2B solutions.
Profitability Projections
Gross Profit Margin: Fastenal’s gross profit margin has remained stable in the mid-40% range, ending at 45.23% in LTM. Despite a slight decline over the years, this margin is expected to stabilize at approximately 45% due to its strong cost control measures, economies of scale, and enhanced supply chain management. The projected gross profit is estimated as follows:
2025: $3.61 billion
2026: $3.85 billion
2027: $4.08 billion
2028: $4.31 billion
Operating Margin: Fastenal’s operating margin has consistently remained above 20%, finishing at 20.31% in LTM. As the company scales further, operating margins are expected to remain stable at approximately 20%. Operating income projections include:
2025: $1.61 billion
2026: $1.71 billion
2027: $1.82 billion
2028: $1.92 billion
Net Profit Margin: Fastenal’s net profit margin has grown to 15.44% in LTM with consistent improvements. This margin is projected to remain stable in the 15-16% range due to disciplined cost control and operating efficiencies. Net income projections include:
2025: $1.20 billion
2026: $1.30 billion
2027: $1.36 billion
2028: $1.47 billion
Free Cash Flow (FCF) and Capital Expenditures (CAPEX)
Free Cash Flow (FCF): Fastenal’s FCF has increased significantly, from $309.92 million in 2014 to $1.04 billion in LTM, with a CAGR of 13.23%. Assuming FCF margins remain stable at approximately 14% of revenue, projections are as follows:
2025: $1.12 billion
2026: $1.20 billion
2027: $1.27 billion
2028: $1.34 billion
CAPEX: As Fastenal transitions to optimizing its infrastructure, CAPEX is expected to remain steady at 2.5-3% of revenue. Projected CAPEX is estimated to range as follows:
2025: $200-240 million
2026: $215-260 million
2027: $225-270 million
2028: $235-290 million
This balanced approach to CAPEX ensures that Fastenal continues to support growth while maintaining financial discipline.
Return on Invested Capital (ROIC) and Return on Capital Employed (ROCE)
Fastenal’s capital efficiency metrics are among the highest in the industrial supply sector:
ROIC: Projected to stabilize at 30% by 2025 and remain in the 30-32% range through 2028, driven by disciplined capital allocation and operational efficiency.
ROCE: Expected to remain in the 38-40% range, reflecting exceptional utilization of equity and debt to generate returns.
These metrics underscore Fastenal’s ability to generate sustainable shareholder value.
Earnings Per Share (EPS) Growth
Assuming the company maintains a stable share count, projected EPS is expected to grow in line with net income:
2025: $2.06
2026: $2.24
2027: $2.36
2028: $2.54
This consistent growth in EPS reflects Fastenal’s commitment to delivering value to shareholders while sustaining profitability.
Sustainability of Growth
Several sustainable factors underpin Fastenal’s growth outlook:
Operational Scalability: The company’s scalable infrastructure supports consistent revenue growth while maintaining profitability.
Strong Margins: Stable operating and net profit margins demonstrate financial discipline and operational efficiency.
Robust Cash Flow Generation: Steady FCF growth ensures liquidity for reinvestment and shareholder returns.
Capital Efficiency: Industry-leading ROIC and ROCE metrics highlight the company’s ability to deploy capital effectively.
11. Value Proposition
11.1 Dividends Analysis
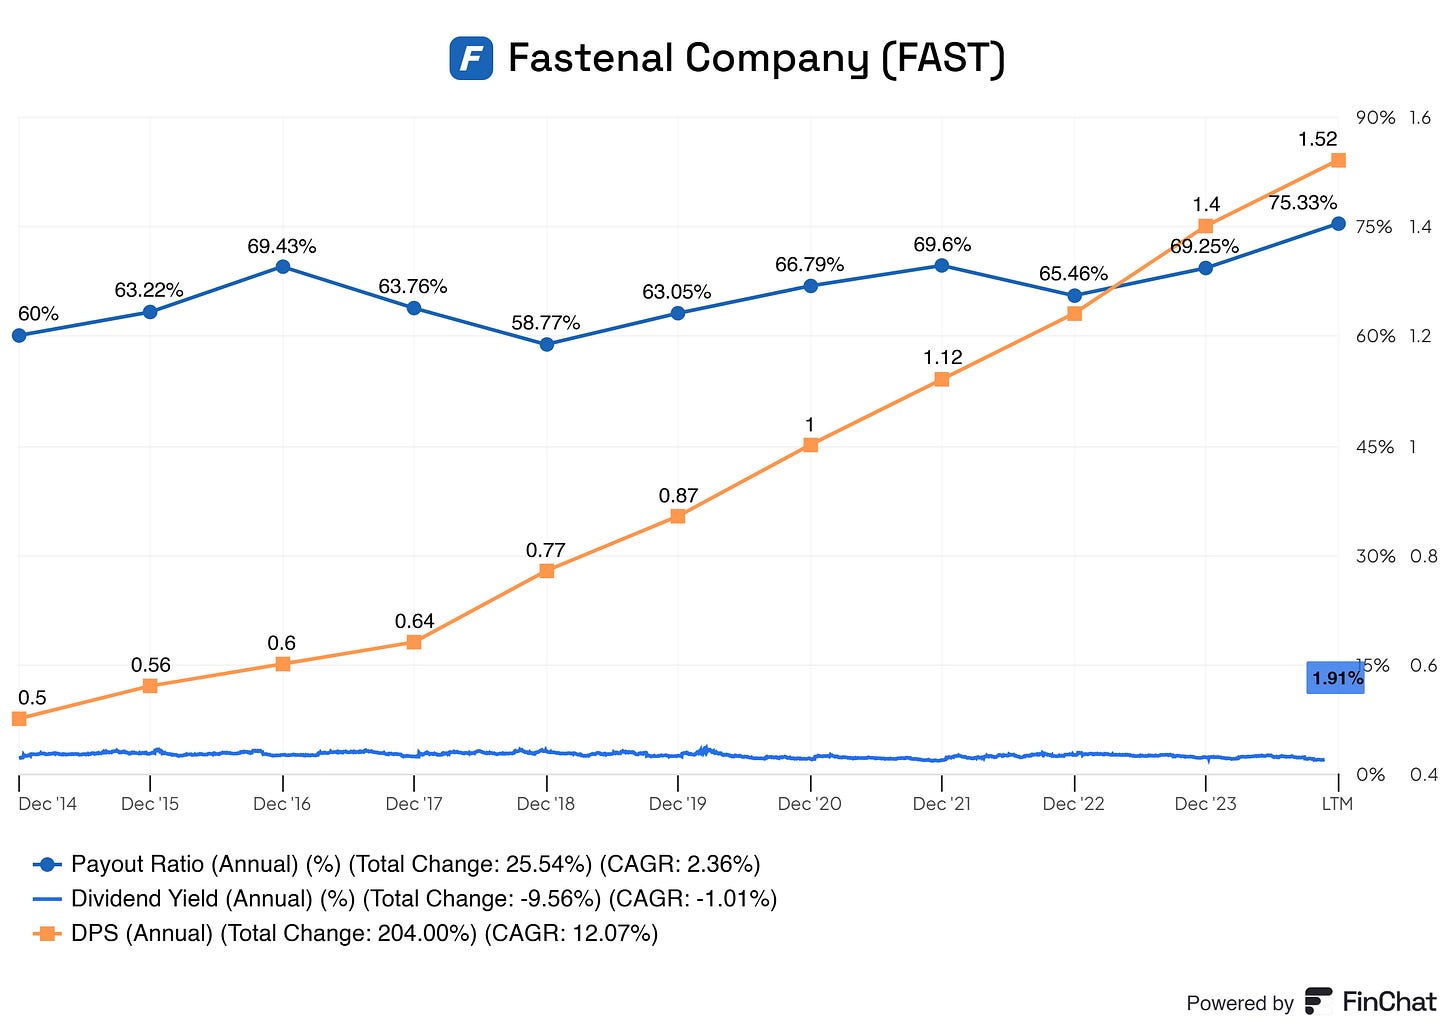
Fastenal does pay a dividend, but it is not something you can write home about. DPS does increase year-over-year, but buying Fastenal solely for its dividends is not the best choice. But yes, Fastenal does create value via dividends!
10.2 Share Repurchase Programs
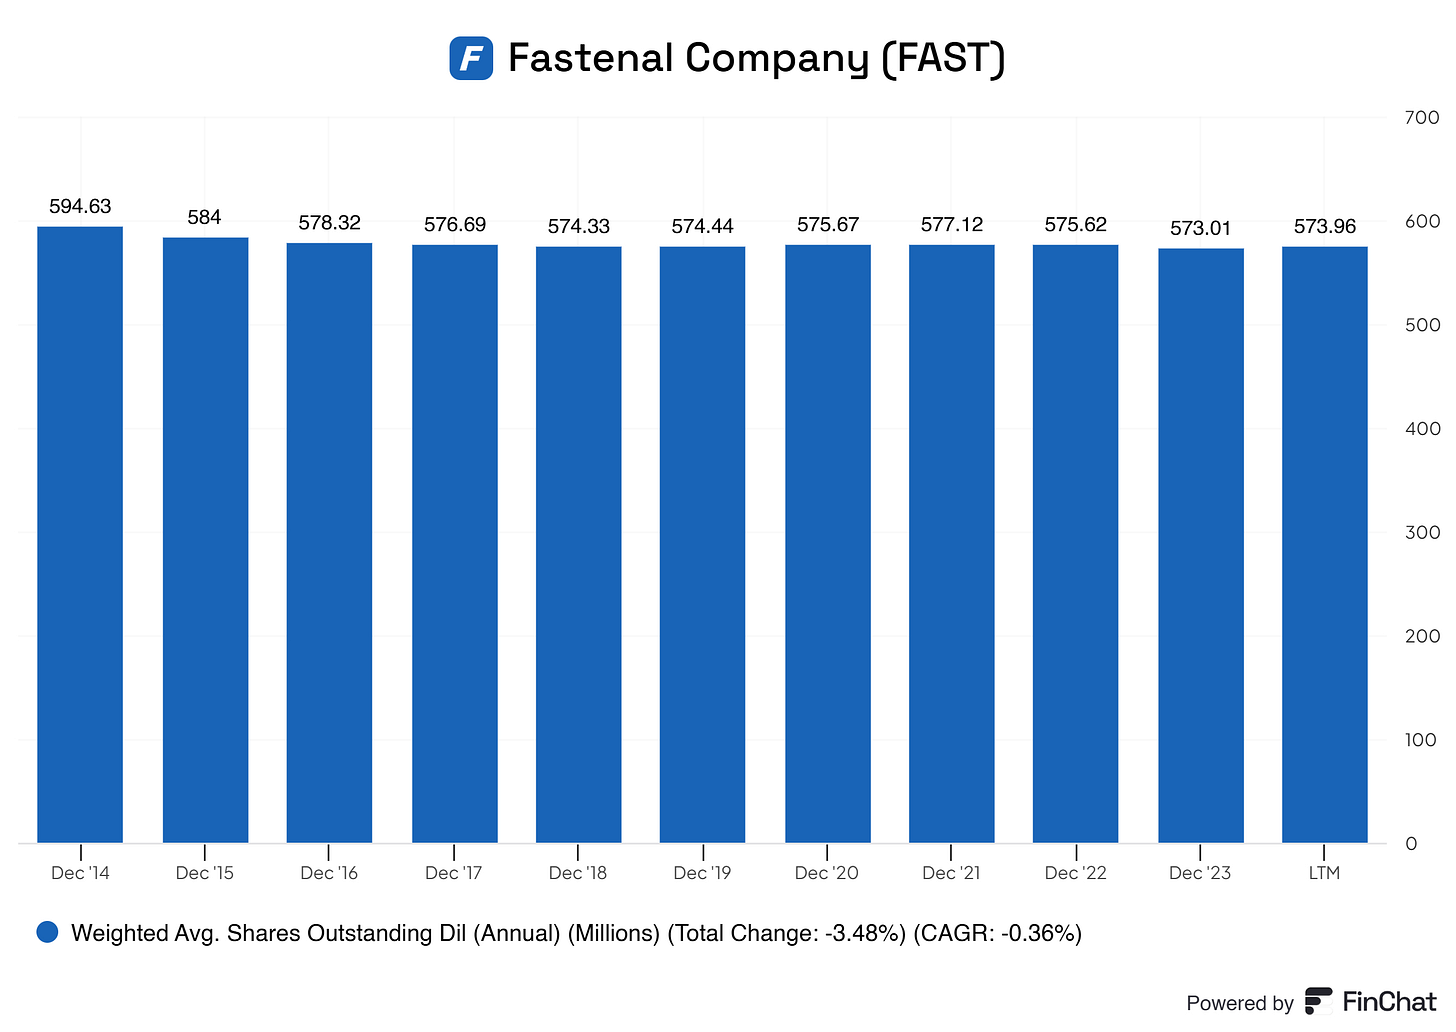
Big fat no here. Fastenal has stable outstanding shares. I would love to see Fastenal start repurchasing shares. This business is not in a hypergrowth phase anymore, so gathering equity via shares is not something they should be doing or is needed. They’re going towards maturing, and repurchasing stocks is a good option here for Fastenal.
11.3 Debt Reduction Strategy
Fastenal is reducing its long-term debts, which is good! Besides, the small debts they have are manageable and should not be their primary focus.
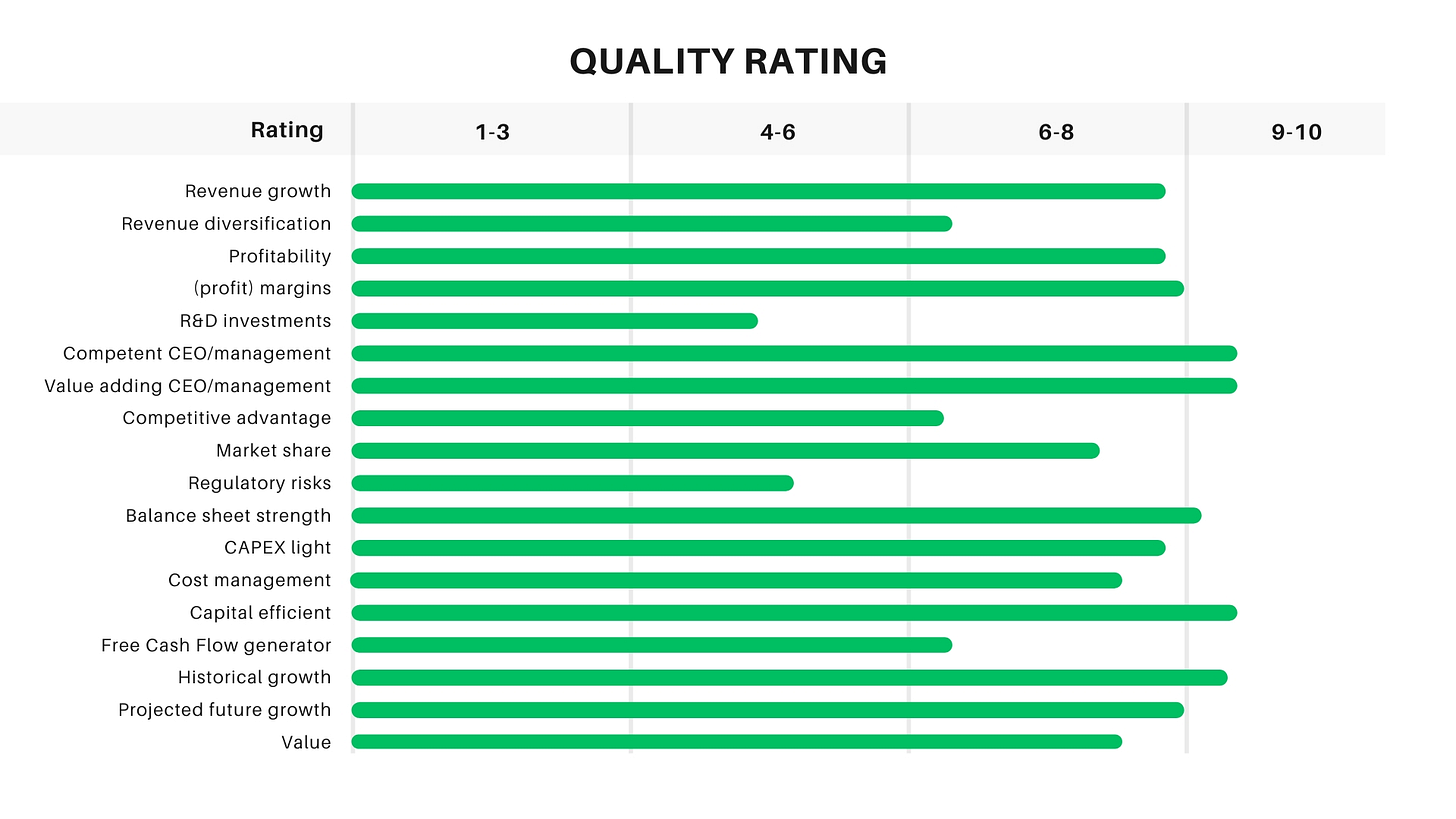
12. Quality Rating
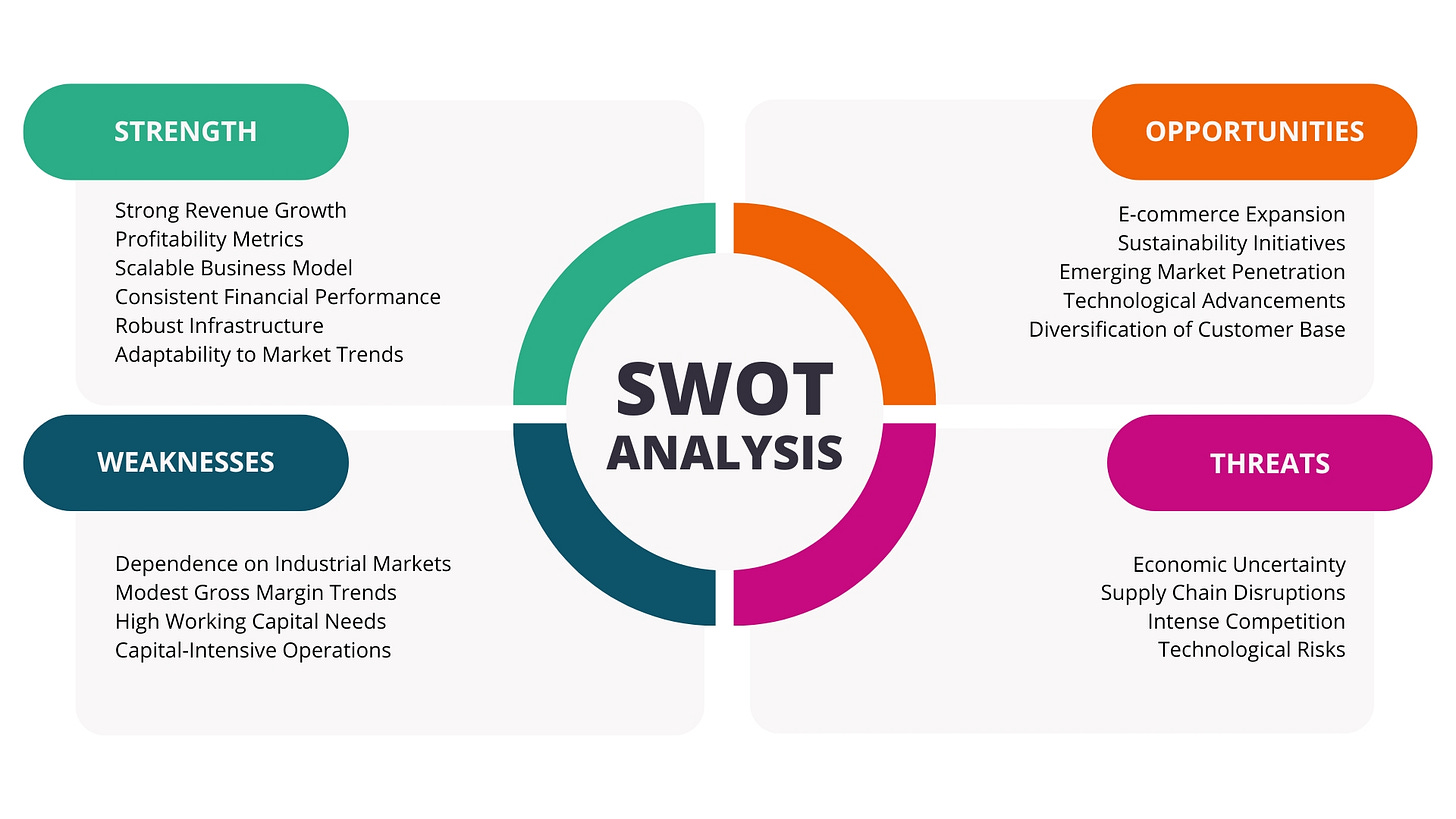
13. SWOT Analysis
14. Valuation Assessment
Before we head over to the valuation of Hims and Hers. Please follow me here on Substack, like this article, and share it with your followers on your favorite social media platform(s).
I put much effort and time into making these investment cases to help you better understand the business.
Let us crunch some numbers!
DCF: $88.65
Multiple Valuation: $22
Benjamin Graham’s Valuation: $54.50
Analysts Average: $88
Average of: $63.29
Current Price: $81.35
At the current levels, Fastenal seems overpriced. I must note that the multiples valuation here was skewed. The $22 seems not reasonable at all, but the multiples for the current sector are depressing, driving the valuation down big time.
In addition, here’s my reverse DCF calculation on Fastenal. This shows that for Fastenal’s current price, 13% growth needs to be achieved from YR1 to YR10. I find this reasonable!
End note
Thank you for reading this investment case on Fastenal!
With every investment case, I am trying to improve my writing and how I communicate my findings with you all. Because I started not too long ago, some posts might change in layout or other aspects before I find the design that suits my best wishes; sorry in advance.
As of now, thank you so much for your time! I hope you found some valuable information in this investment case.
Disclaimer
I do not own Fastenal shares and do not intend to buy any within the next six months.
By reading my posts, being subscribed, following me, and visiting my Substack, you agree to my disclaimer. You can read the disclaimer here.








Great write up
I think you had a copy paste issue with this one and the Hims and Hers deep dive.
“The MOAT for Him and Hers is tricky, but let's try it, shall we?”