KLA Corporation: The Key to the Future of the Semiconductor Industry?
Is KLA the Unsung Hero Driving the Semiconductor Industry Forward?
Hey there, partner! 👋
Before we dive in, I need your support to keep these articles FREE.
If you're enjoying this content, here's how you can help:
Like the article
Please share it on your social media
Comment below to join the conversation
Your engagement means everything. Thanks for being part of the journey! Now, let's get started.
Welcome back to another deep dive into the world of investments. Today, we’re shifting gears to analyze KLA Corporation—one of the key players in the semiconductor industry.
If you’re new here or missed my previous articles, feel free to catch up:
If you haven’t already, hit that follow button for FREE insights to fuel your investment journey. Whether you’re just starting or a seasoned investor, there’s something here for everyone.
Once you’ve finished this analysis, I’d love to hear your thoughts! Be sure to comment, drop a like, and share it with your Substack community if this resonates with you. Your support makes all the difference! 😊
Table of contents
Corporate Analysis
1.1 Business Overview
1.2 Revenue BreakdownExecutive Leadership
2.1 CEO Experience
2.2 Employee Satisfaction Ratings
2.3 CEO Value CreationInsider and institutional ownership
Competitive and Sustainable Advantages (MOAT)
Industry Analysis
5.1 Current Industry Landscape and Growth Prospects
5.2 Competitive LandscapeRisk Assessment
Financial Stability
7.1 Asset Evaluation
7.2 Liability Assessment
7.3 Financial Health Metrics AssessmentCapital Structure
8.1 Expense Analysis
8.2 Capital Efficiency ReviewProfitability Assessment
9.1 Profitability, Sustainability, and Margins
9.2 Cash Flow AnalysisGrowth Analysis
Value Proposition
11.1 Dividend Analysis
11.2 Share Repurchase Programs
11.3 Debt Reduction StrategiesQuality Rating
SWOT Analysis
Valuation Assessment
Conclusion
1. Corporate Analysis
1.1 Business Overview
KLA Corporation designs manufactures, and markets process control, process-enabling, and yield management solutions for the semiconductor and related electronics industries worldwide. It operates through four segments: Semiconductor Process Control, Specialty Semiconductor Process, PCB, Display and Component Inspection, and Others. The company offers integrated circuit (IC) manufacturing products that comprise wafer inspection and review and metrology; wafer and substrate defect inspection and metrology; reticle defect inspection and metrology; chemical/materials quality analysis; in situ process management and wafer handling diagnostics for IC and original equipment manufacturer (OEM) manufacturing; software products to provide run-time process control, defect excursion identification, process corrections, and defect classification; and refurbished and remanufactured products. It also provides specialty semiconductor manufacturing, benchtop metrology, surface characterization, and electrical property measurement services for general purpose/ lab applications, etch, plasma dicing, deposition, and other wafer processing technologies and solutions for the semiconductor and microelectronics industry. In addition, the company offers direct imaging, inspection, optical shaping, additive printing, and computer-aided manufacturing and engineering solutions for the PCB market; inspection and electrical testing systems to identify and classify defects, as well as systems to repair defects for the display market; and inspection and metrology systems for quality control and yield improvement in advanced and traditional semiconductor packaging markets. The company was formerly known as KLA-Tencor Corporation but changed its name to KLA Corporation in July 2019. KLA Corporation was incorporated in 1975 and is headquartered in Milpitas, California.
1.2 Revenue Breakdown
KLA Corporation’s revenue segments are split up as follows:
Wafer inspection Revenue
This segment includes revenue from KLA’s advanced wafer inspection systems, which help detect and classify defects during semiconductor manufacturing. These systems ensure higher yield and quality in chip production, making it a critical component of semiconductor fabrication.Patterning Revenue
KLA generates revenue from its patterning solutions, which enable precise control and optimization of patterns on semiconductor wafers. These technologies are essential for achieving the miniaturization and complexity required in modern semiconductor designs.Specialty Semiconductors Process Revenue
This segment focuses on revenue from specialized equipment and technologies tailored for unique semiconductor processes. These solutions support the production of cutting-edge devices and emerging applications.PCB and Component Inspection Revenue
Revenue from inspection systems designed for printed circuit boards (PCBs) and other electronic components. These tools ensure reliability and functionality in electronics beyond traditional semiconductor applications.Services Revenue
income derived from KLA’s comprehensive maintenance, support, and upgrade services for its inspection and metrology equipment. This segment reflects the company’s focus on long-term customer relationships and operational uptime.Other Product Revenue
This category captures revenue from ancillary products and solutions that complement KLA’s core offerings, further enhancing the value chain in semiconductor and electronics manufacturing.
KLA stands out with its well-diversified portfolio of products and services—a major strength for any business. As an investor, I value companies with diversified revenue streams. Why? Simple: relying on multiple income sources cushions the blow if one segment slows down, protecting both the business and its investors.
Let’s compare this to a company like Fastenal, which we’ve analyzed before. Fastenal primarily relies on two revenue streams: on-site revenue and branch revenue. If one of these segments struggles, the impact on the company’s overall earnings is immediate and significant.
Now contrast that with KLA. Its revenue model is built on multiple streams, making it far more resilient and sustainable. Think of it like this: imagine you have four jobs, and you lose one. It’s a hassle, sure, but the income from the other three keeps you afloat. Now imagine you have just one job, and you get laid off. Suddenly, you’re in a much tougher spot—scrambling to cover expenses while looking for a new source of income.
KLA’s diversified revenue streams act like those multiple jobs, offering stability and security. Even if one area takes a hit, the business remains strong, thanks to the contributions from its other segments.
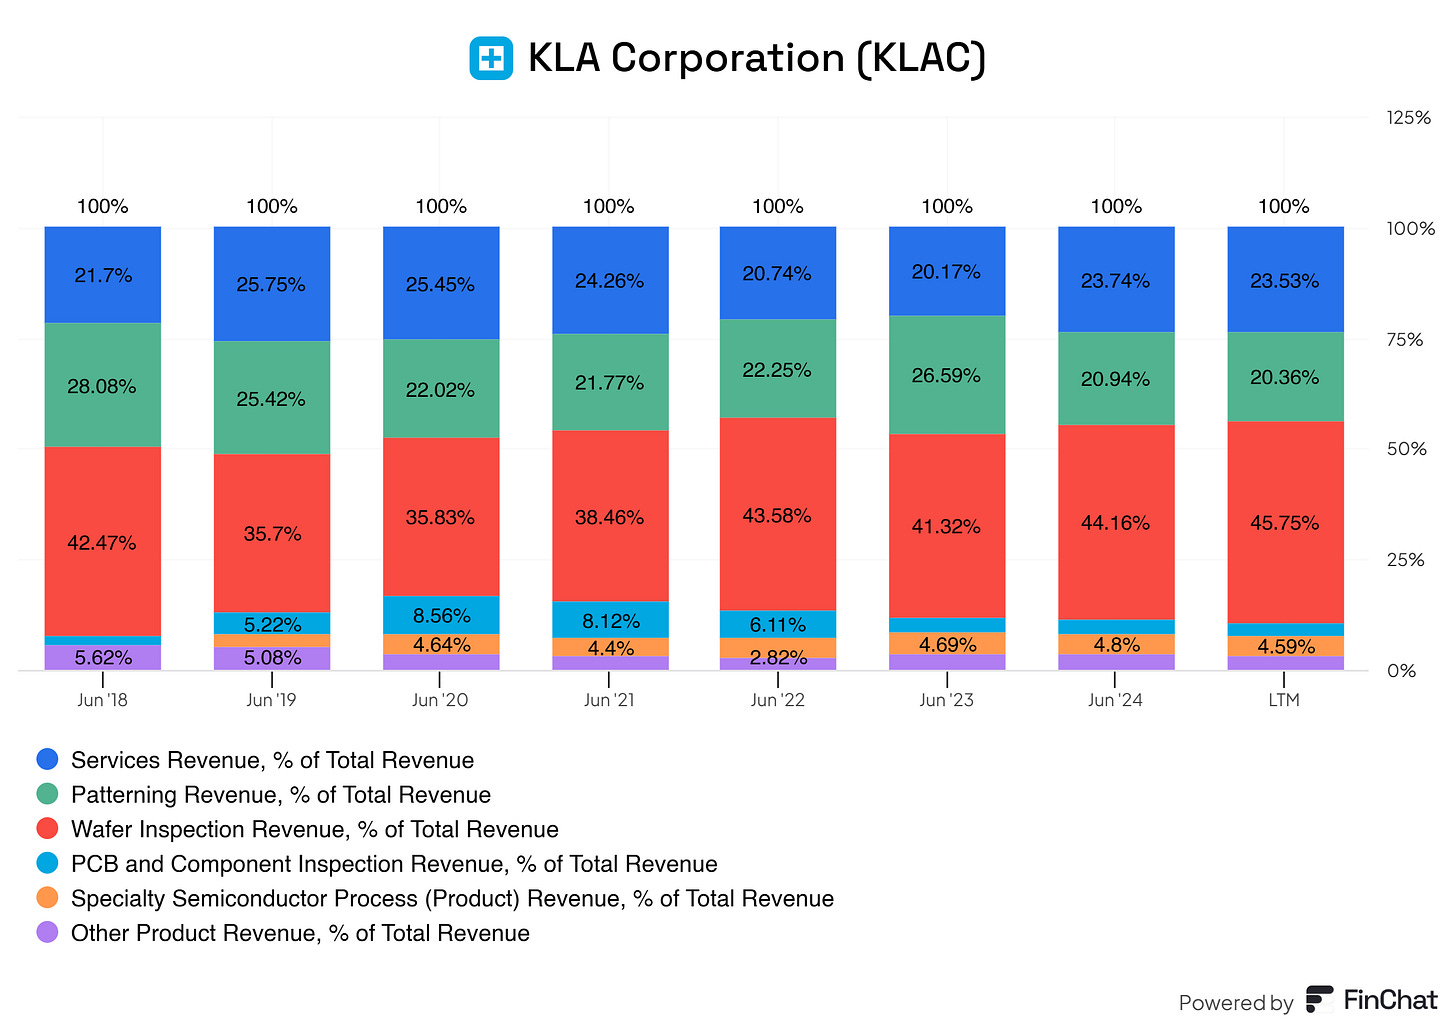
Let’s take a closer look at KLA’s segments and how they stack up against its Total Revenue. By examining each segment’s contribution, we can better understand the strength and balance within KLA’s business model.
What really stands out about KLA is that its biggest revenue drivers are Wafer Inspection, Patterning Revenue, and Services Revenue. Together, these three segments make up the lion’s share of the company’s total revenue. Meanwhile, smaller segments like Specialty Semiconductor Process Revenue, Other Products Revenue, and PCB and Component Inspection Revenue contribute less than 5% each.
Looking at the trends, most segments have shown stabilization over time—except for PCB and Component Inspection Revenue, which has been steadily declining since 2020 and continues to drop in the latest twelve months. Should this worry us? Honestly, no. KLA’s primary focus is on its top three revenue drivers, as it should be. While the PCB segment is a nice addition, its decline doesn’t jeopardize the company’s overall performance.
Why is PCB revenue shrinking? It likely reflects shifting industry priorities. Semiconductor manufacturers are pouring more resources into cutting-edge technologies like advanced wafer inspection and process control. As a result, traditional PCB inspection tools are becoming less essential. Plus, heightened competition in this area could be squeezing margins and reducing revenue.
Despite this, KLA’s portfolio remains rock solid. Its top segments are stable, contributing consistently to total revenue and reinforcing its strong positioning in the semiconductor industry.
Now, let’s take a closer look at how KLA’s revenue is distributed across regions. What story does this tell us? Let’s dive in!
KLA primarily gets its revenue from, in chronological order:
China
North America
Taiwan
Korea
Japan
Europe and Isreal
Rest of Asia
KLA Corporation showcases impressive geographical diversification, a critical strength in the highly globalized semiconductor manufacturing industry. Its revenue streams span key markets, including Taiwan, North America, Japan, Korea, Europe, and the Rest of Asia. This spread acts as a buffer, protecting KLA from regional economic slowdowns and geopolitical risks. But the most striking trend is the sharp rise in revenue from China.
Over the years, China’s share of KLA’s revenue has skyrocketed—from just 8.88% in 2013 to a whopping 42.6% in the latest twelve months. This growth mirrors China’s aggressive investments in semiconductor manufacturing as it strives to create a self-sufficient chip supply chain. Companies like SMIC have been ramping up production, and KLA is reaping the rewards through increased demand for its process control and inspection tools. It’s no exaggeration to say that KLA has firmly positioned itself in one of the world’s fastest-growing semiconductor markets.
KLA anticipates that revenue from China will decrease to about 30% of their total revenue in 2025. This expected decline is attributed to Chinese customers digesting the equipment investments made over the past couple of years. KLA's management refrained from speculating on the potential impact of export controls on their business in China, stating they would assess the impact if and when such controls are implemented
- Earnings Call Q1 2025
However, this rising dependence on China isn’t without its risks. The ongoing U.S.-China trade tensions and restrictions on exporting advanced semiconductor tools to China could complicate things. With China now accounting for over 40% of KLA’s revenue, the company is more exposed to any slowdown in Chinese semiconductor investments, broader economic challenges, or tightening government policies. A dip in China’s semiconductor activity could disproportionately impact KLA’s growth trajectory.
That said, this dependence also represents a tremendous opportunity. KLA has adeptly capitalized on China’s ambitions to develop a world-class semiconductor industry, securing a dominant foothold in the process. At the same time, its revenue streams from other regions—like Taiwan, North America, and Japan—help mitigate some of the risks associated with China’s increasing share.
Moving forward, KLA needs to maintain a delicate balance. The company must navigate regulatory challenges while continuing to expand in other regions to reduce overexposure to China. Strong relationships in established markets like Taiwan and Japan, coupled with diversified revenue streams, are critical to its long-term resilience and growth.
For investors, keeping a close eye on how KLA manages its reliance on China and regulatory risks will be key to understanding its future trajectory.
2. Executive Leadership
2.1 CEO Experience
The CEO of KLA has a remarkable career spanning over three decades, showcasing extensive leadership experience and a strong track record in the semiconductor industry and beyond. Since February 1988, they have held various roles at KLA, culminating in their appointment as President and CEO in January 2006. Under their leadership, KLA has maintained its position as a global leader in process control and yield management solutions, driving innovation and growth in the semiconductor industry for nearly 19 years.
Before becoming CEO, they spent 17 years in various positions at KLA, building deep expertise in the company’s operations and technologies. Their career began at Procter & Gamble, where they worked as an engineer from 1982 to 1984, followed by a role as a lithography engineer at Cypress Semiconductor from 1984 to 1987. These early engineering roles gave them a strong technical foundation that has been instrumental in their leadership.
In addition to their role at KLA, they have served on the boards of several prominent technology companies. They were a board member at Marvell Technology from April 2024 and at Splunk from October 2022 to March 2024. Other notable board positions include NetApp (2011–2019), Proofpoint (2017–2021), and Beckman Coulter (2009–2011). They also contributed to the Silicon Valley Leadership Group (2011–2015) and SEMI (2005–2014), organizations dedicated to fostering innovation and leadership in the tech sector.
With nearly 37 years at KLA, their experience reflects an unparalleled commitment to advancing the semiconductor industry while contributing to the broader tech community through board service and leadership roles. Their career is a testament to their ability to drive growth, innovation, and strategic vision across multiple organizations.
2.2 Employee Satisfaction Ratings
Out of 1,174 reviews on Glassdoor, KLA boasts an impressive 94% CEO approval rating for Rick Wallace and an overall company rating of 4 out of 5 stars. These numbers speak volumes about the positive environment and leadership at KLA.
Such a high rating suggests that Rick Wallace has built a workplace culture that is not only supportive but also sustainable—a critical foundation for any business aiming for long-term success. As many of you know, I strongly believe that a company’s culture is more than just a feel-good factor. It’s the glue that holds the business together. A strong, positive culture drives employee satisfaction, encourages innovation, and lays the groundwork for lasting success. In KLA’s case, this culture shines through both in its Glassdoor reviews and in its operational performance.
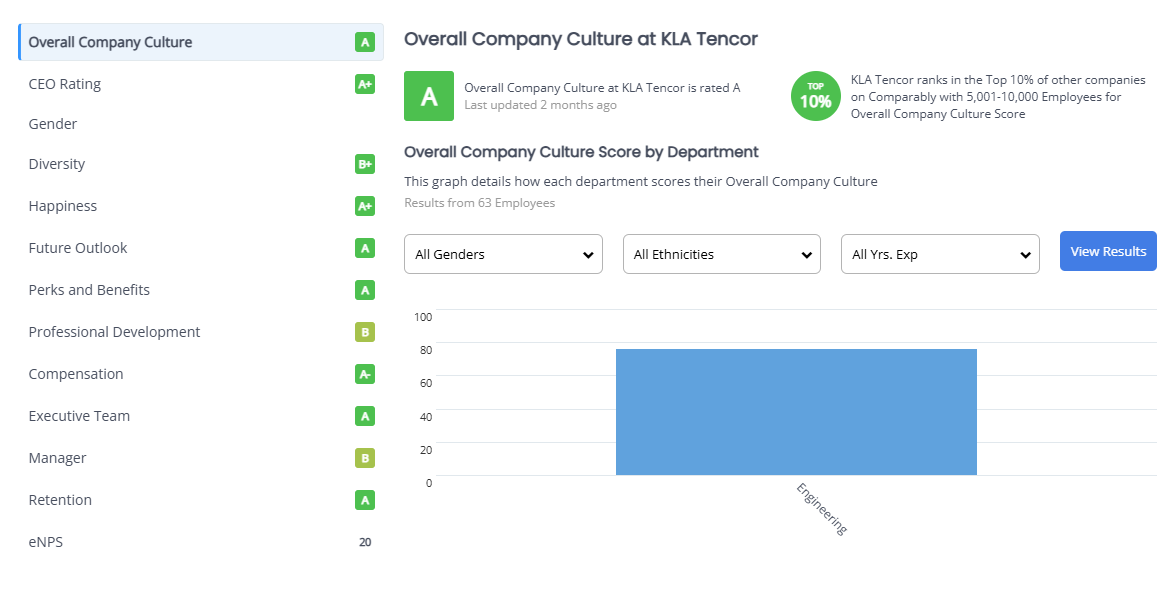
To see if this aligns with feedback from Comparably, another platform similar to Glassdoor, let’s dive into what employees there have to say about KLA.
Wow! KLA truly excels across the board. It’s rare to see a company of this scale maintaining such consistent performance with its employees. As businesses grow, it’s common for management to lose touch with their teams, leading to rising dissatisfaction and declining Net Promoter Scores (NPS). But KLA defies this trend. The company has managed to preserve its strong culture while keeping employees engaged and satisfied—a feat that’s easier said than done.
What’s truly impressive is how KLA continues to uphold such a positive environment even as it grows. This is no small achievement and speaks volumes about the leadership and values embedded in the company. It’s inspiring to see a business thrive not just financially but also in the way it treats its people.
2.3 CEO Value Creation
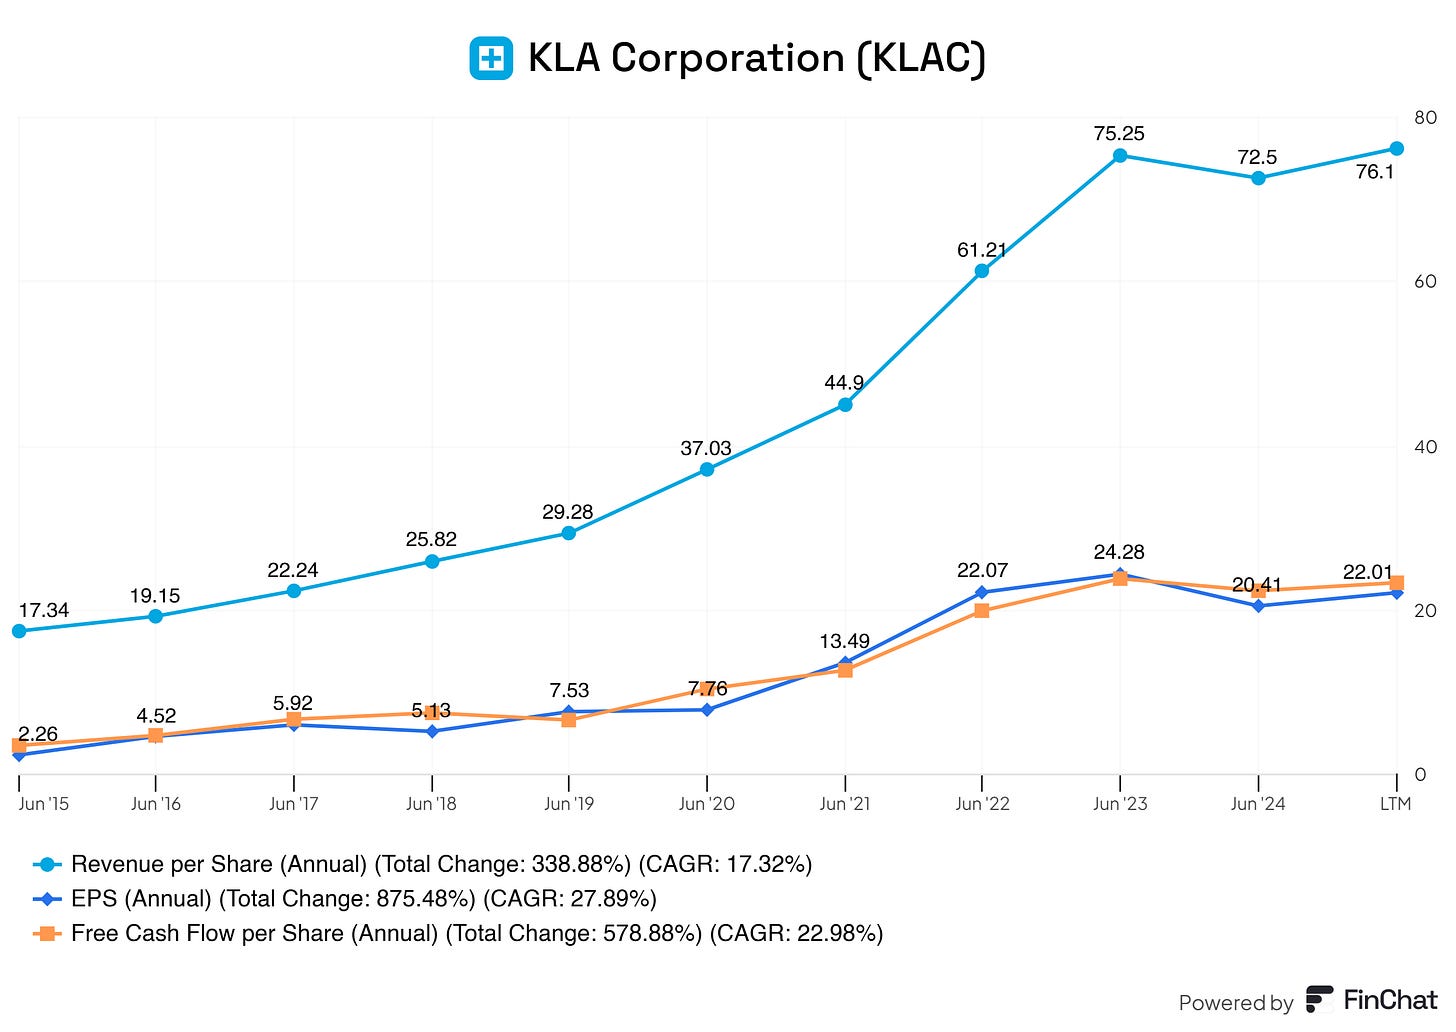
Does Rick Wallace create value for KLA Corporation and its shareholders?
Yes, it does! We can see wonderful growth in earnings per share (EPS), revenue per share, and free cash flow per share.
3. Insider and institutional ownership
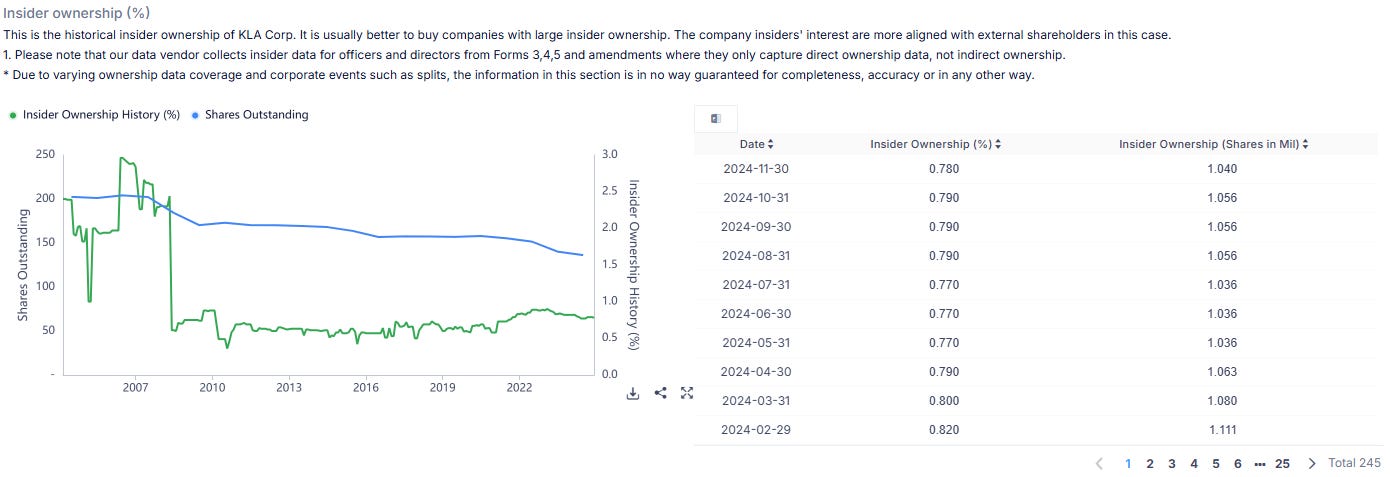
Insider ownership is a critical factor I look at when evaluating a business. Why? Because when management has skin in the game, their interests are aligned with ours as investors. This alignment shows that they’re not just steering the ship—they’re on the same journey, with the same destination in mind: growing the business and creating long-term value.
When management directly benefits from the company’s success, it provides a powerful incentive to make decisions that prioritize sustainable growth and enhance shareholder value. Simply put, when the business thrives, they thrive, and so do we. This kind of alignment is a hallmark of a well-run company and a key indicator of a shareholder-friendly management team.
There’s limited skin in the game when it comes to KLA. Ideally, I’d like to see insiders holding around 3% of the total outstanding shares. Of course, that’s a rarity these days, but it’s something I always keep in the back of my mind when evaluating a company.
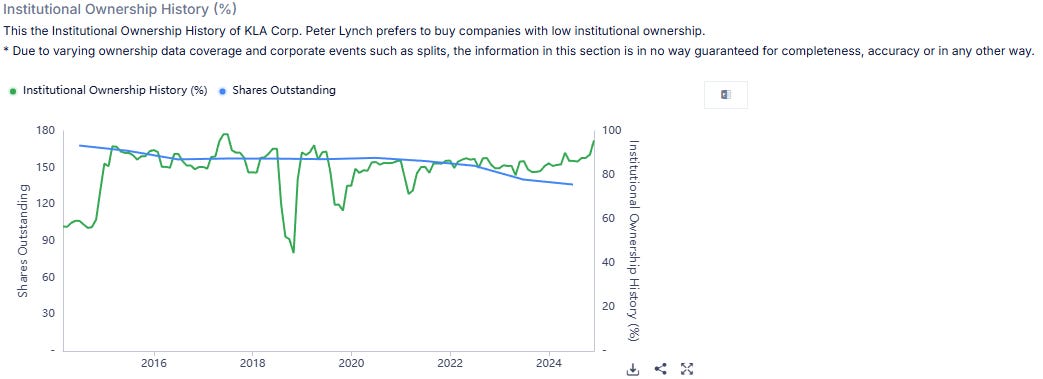
Right now, most of KLA’s shares are in the hands of the big players—the institutions. Insider ownership is sitting at a modest 0.78%, while institutional ownership dominates at a staggering 95.71%. The remaining 3.51% is held by others, like private equity. So, in KLA’s case, I’d love to see “others” become insiders, haha! It’s worth noting, though, that the high institutional ownership reflects strong confidence from major investors, which is still a positive sign overall.
As you can see, institutions favor KLA as an investment and are piling up on their positions.
Now, let us take a closer look at how the 0.78% inside ownership is distributed amongst management!
We can see that most of the inside-owned shares are owned by Rick Wallace (CEO), Bren D. Higgins (EVP & CFO), Ahmad A. Khan (President, Semi Proc. Control), and Asher Levy.
But are insiders buying KLA?
No, they’re not, unfortunately..
I was crossing my fingers, hoping to find that insiders at KLA were increasing their positions. Unfortunately, the opposite is true. Insider ownership has been on a steady decline. Back on February 29, 2024, insiders owned around 0.82% of the company, but that figure has since slipped to 0.78%.
It’s disappointing to see insiders reducing their already minimal stake. Even small levels of insider ownership provide a sense of alignment with investors, and watching that alignment fade is definitely a letdown. It’s not a dealbreaker, but it’s something that leaves me wishing for more confidence from the inside.
4. Competitive and Sustainable Advantage (MOAT)
So, a MOAT can be in either one or more of the following forms:
Brand Power
Patents
Scale and Cost Advantages
Switching Costs
Network Effect
Attracting Talent (I consider this a MOAT, others don’t. Decide for yourself)
Brand Power
KLA Corporation is a recognized leader in the semiconductor industry's process control and yield management solutions. Its brand is synonymous with precision and innovation, making it the go-to provider for critical inspection and metrology tools. KLA's reputation for reliability and advanced technology ensures that semiconductor manufacturers trust its products to maintain high yields and minimize defects. This trust builds customer loyalty and strengthens KLA's position as a key partner in the semiconductor supply chain.
Patents
KLA has a robust portfolio of patents that protect its advanced technologies in inspection, metrology, and process control. These patents create significant barriers to entry for competitors, as replicating KLA’s technology would require substantial R&D investment and time. For example, KLA’s proprietary algorithms and optical technologies are critical to detecting microscopic defects during semiconductor fabrication, a capability that few competitors can match. This intellectual property secures KLA’s market position and gives it a competitive edge in innovation-driven industries.
Scale and Cost Advantages
KLA benefits from significant economies of scale as a leading player in the semiconductor equipment market. Its extensive global operations and large customer base allow it to spread high fixed costs, such as R&D and manufacturing, across a broad range of products and customers. This scale advantage enables KLA to invest heavily in developing cutting-edge solutions while maintaining competitive pricing. Its strong customer relationships and repeat business also provide a stable revenue base that further enhances its cost efficiency.
Switching Costs
Switching costs are a major moat for KLA. Its tools are deeply integrated into semiconductor manufacturing processes, and customers rely heavily on KLA's systems for quality assurance and yield improvement. Replacing KLA’s equipment with a competitor’s would require a substantial investment in new tools and disrupt production processes and risk lower yields. These high switching costs lock in customers and ensure long-term business relationships, making KLA an indispensable partner in the semiconductor ecosystem.
Network Effect
While the traditional network effect (where value increases with more users) may not directly apply to KLA, there is a form of ecosystem-driven network effect. KLA’s tools generate vast amounts of process data, which can be analyzed to improve manufacturing efficiency. As more semiconductor manufacturers use KLA’s solutions, the company can leverage this data to refine its algorithms and offer even better performance, creating a positive feedback loop. This enhances KLA's value proposition and further solidifies its leadership position.
Attracting Talent
KLA's position as an industry leader allows it to attract top-tier talent in engineering, software development, and process technology. The company’s reputation for innovation and its focus on solving complex challenges make it an appealing destination for professionals passionate about the semiconductor industry. Furthermore, KLA invests heavily in employee development and fostering a strong organizational culture, ensuring it retains its talent and maintains its competitive edge.
5. Industry Analysis
5.1 Current Industry Landscape and Growth Prospects
The semiconductor manufacturing equipment industry is at the core of technological advancements across the globe. This sector is indispensable to producing semiconductors, which power virtually every modern electronic device, from smartphones and laptops to electric vehicles and advanced data centers. The market's evolution reflects the increasing complexity of semiconductor designs and the rising demand for high-performance and energy-efficient devices.
Market Size and Growth
The global semiconductor manufacturing equipment market was valued at USD 110.91 billion in 2023 and is projected to grow at a compound annual growth rate (CAGR) of 10.6%, reaching an estimated USD 270.38 billion by 2032. This rapid expansion is fueled by several factors, including:
Miniaturization of devices: A growing demand for smaller, faster, and more efficient electronic devices.
5G and IoT adoption: These technologies require advanced semiconductors to enable connectivity and data processing.
Increased semiconductor use across industries: From consumer electronics to automotive and industrial applications.
Regional Leadership
The Asia Pacific dominates the market, holding a 67.89% share in 2023. This leadership is driven by countries like Taiwan, China, South Korea, and Japan, major semiconductor manufacturing hubs. Taiwan, home to companies like TSMC, is particularly critical, with significant investments in advanced technologies like 5G, AI, and automotive applications.
North America and Europe are also key players, with notable contributions from companies like KLA Corporation, Lam Research, Applied Materials, and ASML. The U.S. has seen increased government and private-sector investments to bolster domestic semiconductor production, while Europe is leveraging subsidies and strategic partnerships to expand its capabilities.
Trends Driving the Industry
Technological Advancements: Cutting-edge technologies such as nano-imprinting, lithography, and artificial intelligence (AI) are reshaping the industry. These innovations enhance production speed, precision, and cost efficiency, making them critical for meeting market demand.
For example, ASML’s EUV lithography machines are integral to producing the most advanced semiconductor chips, enabling miniaturization and increased performance.
Shift Towards Smart Manufacturing: Integrating Industry 4.0 principles and IoT-driven automation is revolutionizing production processes. Real-time data, predictive maintenance, and AI-based process controls are improving efficiency and reducing waste.
Increased Demand for Electric Vehicles (EVs): The rapid growth of the EV market is driving demand for power semiconductors and discrete devices. In 2021, global EV sales surged by 109%, highlighting a significant growth opportunity for semiconductor equipment manufacturers.
Sustainability Focus: There is a growing emphasis on energy efficiency and reducing environmental impact. Companies are adopting greener technologies and production methods to align with global sustainability goals.
Business Model Evolution: Equipment-as-a-service models are gaining traction, allowing medium-scale organizations to access advanced semiconductor manufacturing tools without the upfront capital investment. This model also broadens the customer base and accelerates innovation.
Growth Challenges
While the prospects are strong, the industry faces certain challenges:
High Capital Costs: Manufacturing equipment can cost billions, limiting access to smaller players.
Complexity in Design: As semiconductor designs become more intricate, the need for precision increases, raising production costs and requiring cutting-edge equipment.
Supply Chain Disruptions: Events like the COVID-19 pandemic and geopolitical tensions have highlighted vulnerabilities in the supply chain, emphasizing the need for diversification.
Future Outlook
The semiconductor manufacturing equipment industry is poised for robust growth over the next decade, driven by technological innovations and rising global demand for semiconductors. Key growth areas include:
3D semiconductor architecture: Aiming for higher efficiency and functionality in compact devices.
Advanced applications: Supporting AI, machine learning, and high-bandwidth memory (HBM) technologies.
Government Initiatives: Investments and subsidies to localize production and reduce import reliance.
In summary, the semiconductor manufacturing equipment industry will thrive as it adapts to new technologies and increasing demand. Companies like KLA Corporation are well-positioned to capitalize on these trends, leveraging their expertise and innovation to drive long-term growth in this dynamic sector.
5.2 Competitive Landscape
Who are KLA Corporation's peers or competitors in the market? I identify the following:
Please note the following: Among the listed companies, ASML, Applied Materials, and Lam Research are the closest competitors to KLA, but even then, their focus areas are complementary rather than directly overlapping. KLA uniquely specializes in inspection and process control systems, making it a niche leader within the semiconductor equipment industry.
Therefore, take the following ‘comparison’ with a grain of salt; thanks!
ASML
Applied Materials
Lam Research
Operating Margin
KLA sets itself apart with an impressive operating margin of 37.58%, the highest among its peers. This reflects the company’s operational efficiency and its focus on high-margin segments like inspection and metrology. By comparison, ASML’s operating margin is 30.72%, Applied Materials sits at 28.95%, and Lam Research is at 29.23%. KLA’s strong emphasis on process and yield management enables it to maintain superior cost control and profitability, solidifying its leadership in this area.
Gross Profit Margin
When it comes to gross profit margin, KLA leads the pack again at 59.75%, far ahead of ASML (51.15%), Applied Materials (47.46%), and Lam Research (47.69%). This showcases KLA’s ability to command premium pricing for its advanced, highly specialized equipment. Its critical role in semiconductor manufacturing allows it to sustain these strong margins, making its products indispensable in the production process.
Return on Invested Capital (ROIC)
KLA shines with an average ROIC of 37.7% over the past five years, highlighting its exceptional capital efficiency. While Lam Research edges slightly higher at 41.73%, KLA outperforms ASML (23.18%) and Applied Materials (34.34%). This underscores KLA’s ability to generate significant returns on its investments, particularly in R&D and manufacturing capabilities, which are vital in the capital-intensive semiconductor industry.
Revenue Growth (5-Year CAGR)
ASML leads revenue growth with a 5-year CAGR of 19.15%, driven by its dominance in EUV lithography. KLA follows closely with an impressive 15.97%, outperforming Applied Materials (13.22%) and Lam Research (10.44%). KLA’s growth reflects its strength in process control and metrology, both critical as semiconductor manufacturing becomes increasingly complex.
Diluted EPS Growth (5-Year CAGR)
KLA’s EPS growth of 25.15% is highly competitive, just shy of ASML’s 26.98% and ahead of Applied Materials (24.66%) and Lam Research (17.87%). This illustrates KLA’s ability to effectively convert revenue growth into shareholder value, driven by its profitability and operational discipline.
Net Profit Margin
With a net profit margin of 28.92%, KLA leads the industry once again. It edges out ASML (26.4%), Applied Materials (26.41%), and Lam Research (26.02%). This margin superiority highlights KLA’s robust cost structure and its ability to retain more earnings as profit, reinforcing its financial strength.
Market Capitalization
KLA’s market cap of $87.99B positions it as a significant player in the semiconductor industry, though smaller than ASML ($285.08B) and Applied Materials ($140.19B). It remains comparable to Lam Research ($98.38B). While ASML dominates due to its EUV lithography leadership, KLA’s specialization in process control and metrology ensures its pivotal role in the industry’s growth.
In summary, KLA excels in profitability and operational efficiency, distinguishing itself as a leader in its niche. While it does not match ASML’s scale or Applied Materials’ breadth, KLA’s specialized focus and financial discipline make it one of the strongest players in the semiconductor manufacturing equipment market.
KLA had the following to say about their competitors:
we have many competitors, including companies such as Applied Materials, Inc., ASML Holding N.V., Hitachi High-Technologies Corporation, Onto Innovation, Inc. and Lasertec, Inc., some of which may have greater financial, research, engineering, manufacturing and marketing resources than we have. We expect our competitors to continue to improve the design and performance of their current products and to introduce new products with improved pricing and performance characteristics
- KLA Annual Report
6. Risk Assessment
Over-Reliance on Specialized Niche (Impact: 4/5)
KLA is highly specialized in process control, inspection, and metrology tools. While this specialization has made it a leader in its niche, it also leaves the company vulnerable to shifts in customer priorities. If semiconductor manufacturers allocate more of their budget toward deposition, lithography, or other technologies, KLA's focus on inspection might reduce its strategic importance. Diversifying its portfolio could mitigate this risk but would require significant R&D investments and could dilute its specialization.
Customer Concentration Risk (Impact: 3/5)
A substantial portion of KLA’s revenue comes from a small number of large customers, such as TSMC, Samsung, and Intel. Any slowdown in capital expenditures by these companies, delays in chip manufacturing roadmaps, or shifts in supplier preferences could lead to significant revenue declines. While KLA serves a broad global market, losing a key customer or reduced orders from top-tier manufacturers would significantly impact its revenue stream.
Regulatory and Trade Risks (Impact: 4/5)
Semiconductor equipment is a highly regulated industry, especially when exporting to countries like China, a major market for KLA. Geopolitical tensions, such as U.S.-China trade wars, restrictions on exporting advanced tools, or changes in government policies, could restrict KLA’s ability to access key markets. Additionally, new regulations on chipmaking technology exports could disproportionately affect KLA's most advanced tools.
Technological Obsolescence and Competitor Advancements (Impact: 5/5)
The semiconductor industry evolves rapidly, with manufacturers demanding ever more precise and efficient tools. If KLA fails to keep pace with advancements in metrology and inspection technologies or if a competitor (e.g., ASML, Applied Materials, or Onto Innovation) develops superior tools, KLA risks losing its competitive edge. This is particularly concerning as the industry moves toward 3D chip architectures and sub-2nm nodes, which will require next-generation process control solutions.
Dependency on the Semiconductor Cycle (Impact: 3/5)
KLA’s revenue is closely tied to the cyclical nature of the semiconductor industry. While demand for semiconductors is growing overall, the industry experiences boom-and-bust cycles due to overcapacity, fluctuating consumer demand, or macroeconomic downturns. A sudden downturn in the cycle could lead to reduced orders for KLA’s equipment, impacting revenue growth and profitability.
Supply Chain Disruptions and Raw Material Dependency (Impact: 4/5)
KLA relies on a complex global supply chain to source components for its equipment. Any disruptions, whether due to geopolitical tensions, natural disasters, or pandemic-related restrictions, could delay production and delivery timelines. Additionally, price volatility or shortages in critical raw materials like rare earth elements could increase costs and reduce margins.
Customer-Side Manufacturing Innovation (Impact: 3/5)
Major customers like TSMC, Intel, and Samsung are investing heavily in in-house process control and inspection technologies. If these customers reduce reliance on external suppliers like KLA, it could weaken KLA's market share and pricing power. For example, the development of proprietary solutions for certain manufacturing processes could make KLA's equipment redundant in specific use cases.
7. Financial Health
7.1 Assets Assessment
When evaluating KLA's financial health, I focus on specific items from the balance sheet that are excellent and deserve to be mentioned, raise concerns, have the potential to cause trouble or warrant close monitoring shortly. If I don’t mention a particular item, you can assume it’s an area that meets expectations or doesn’t pose any significant issues. My aim is to highlight only the areas that demand attention or analysis, ensuring a clear and concise review of the company’s financial position.😄
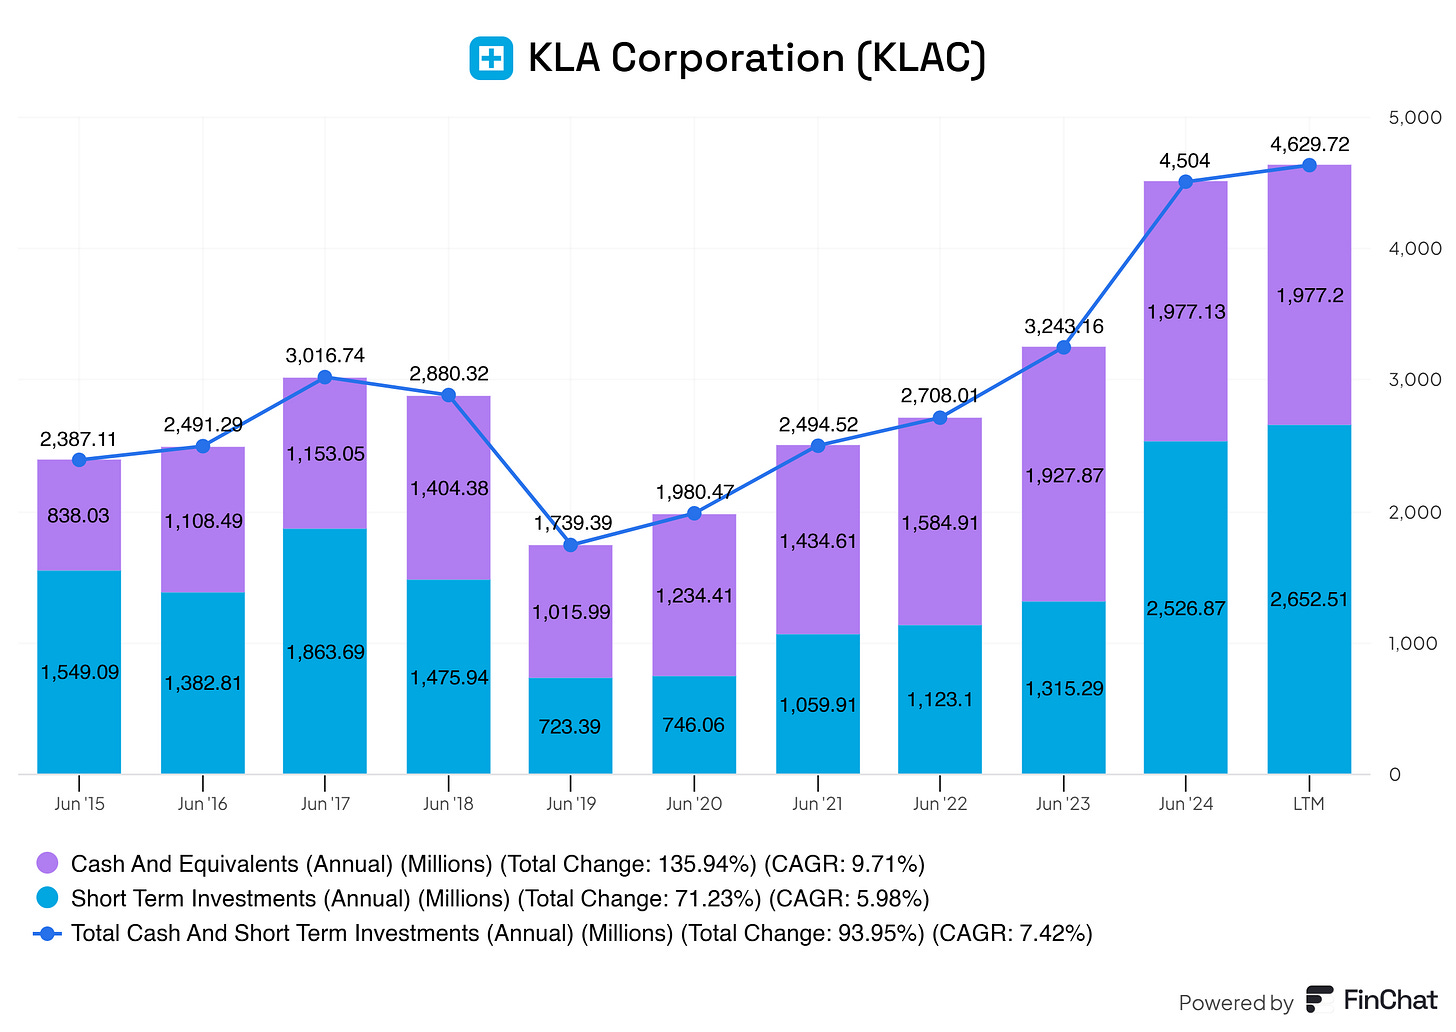
KLA’s steadily increasing cash and short-term investments on its balance sheet is a positive indicator for the business and its investors. Over the years, KLA has consistently grown its cash reserves and short-term investments, nearly doubling them since 2015, as reflected in a 7.42% compound annual growth rate (CAGR). This growth reflects financial prudence and robust operational efficiency, which are critical in a highly capital-intensive industry like semiconductor manufacturing equipment.
A strong cash position provides KLA with a cushion against economic downturns, cyclical declines in semiconductor demand, or unexpected disruptions, such as supply chain issues or geopolitical tensions. This financial resilience reassures investors that the company is well-prepared to weather challenges while continuing to operate smoothly.
The growing cash reserves enable KLA to invest in R&D, pursue acquisitions (a bit more on this later on), and expand its product offerings without relying heavily on external financing. For example, in the semiconductor equipment industry, where technological advancement is paramount, KLA can allocate capital to process control and inspection technologies to maintain its competitive edge. This positions the company to capture new growth opportunities, further strengthening investor confidence.
KLA is continuously looking for acquisitions, KLA said the following:
We continuously evaluate strategic acquisitions and alliances to expand our technologies, product offerings and distribution capabilities.
- KLA annual report
With increasing cash reserves, KLA is positioned to return value to shareholders through dividends and share buybacks. Historically, companies with consistent cash flow growth and strong reserves often prioritize rewarding their investors, which enhances shareholder value and boosts investor sentiment.
This kind of YoY increasing reserve has multiple benefits for the business as well:
Operational flexibility
The ability to address industry cyclicality
Stronger negotiation power
Commitment to innovation
7.2 Liabilities Assessment
KLA has a clean liabilities sheet! There are some slight YoY increases in the long-term debt of KLA, but this is nothing we should worry about. These debts are easily covered with the FCF and
7.3 Financial Health Metrics Assessment
Here we take a closer look at the metrics of KLA’s financial health; the following are the most important to me, the business, and (potential) investors:
Current Ratio
Debt / Equity
Net Debt / EBITDA
EBITDA / Interest Expense
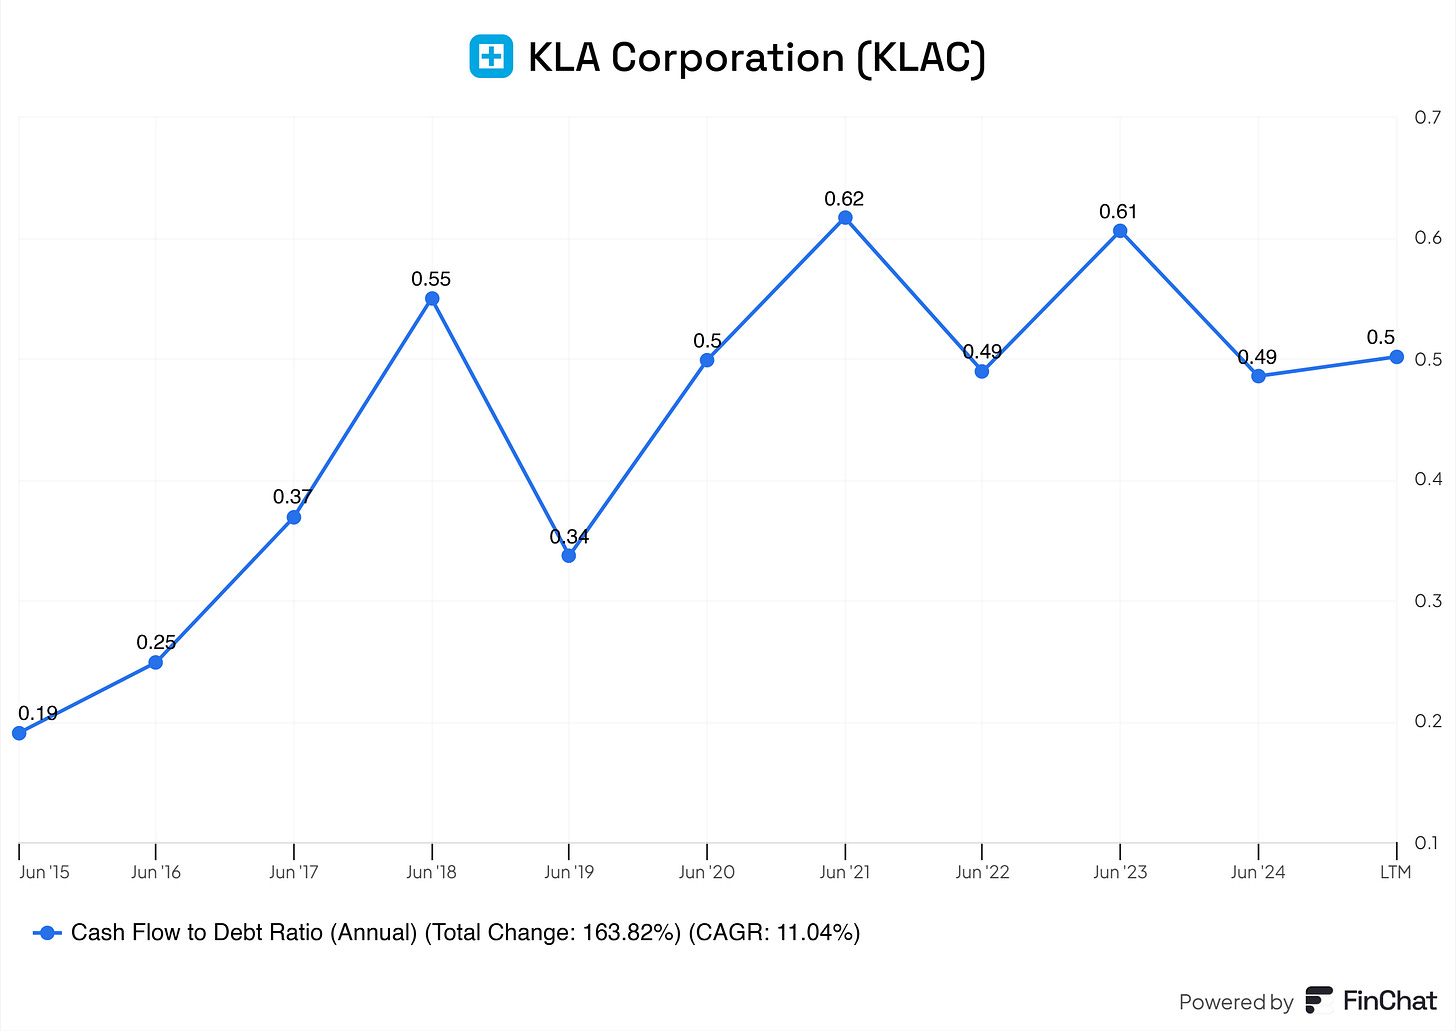
Cash Flow to Debt Ratio
EBIT / Interest Expense
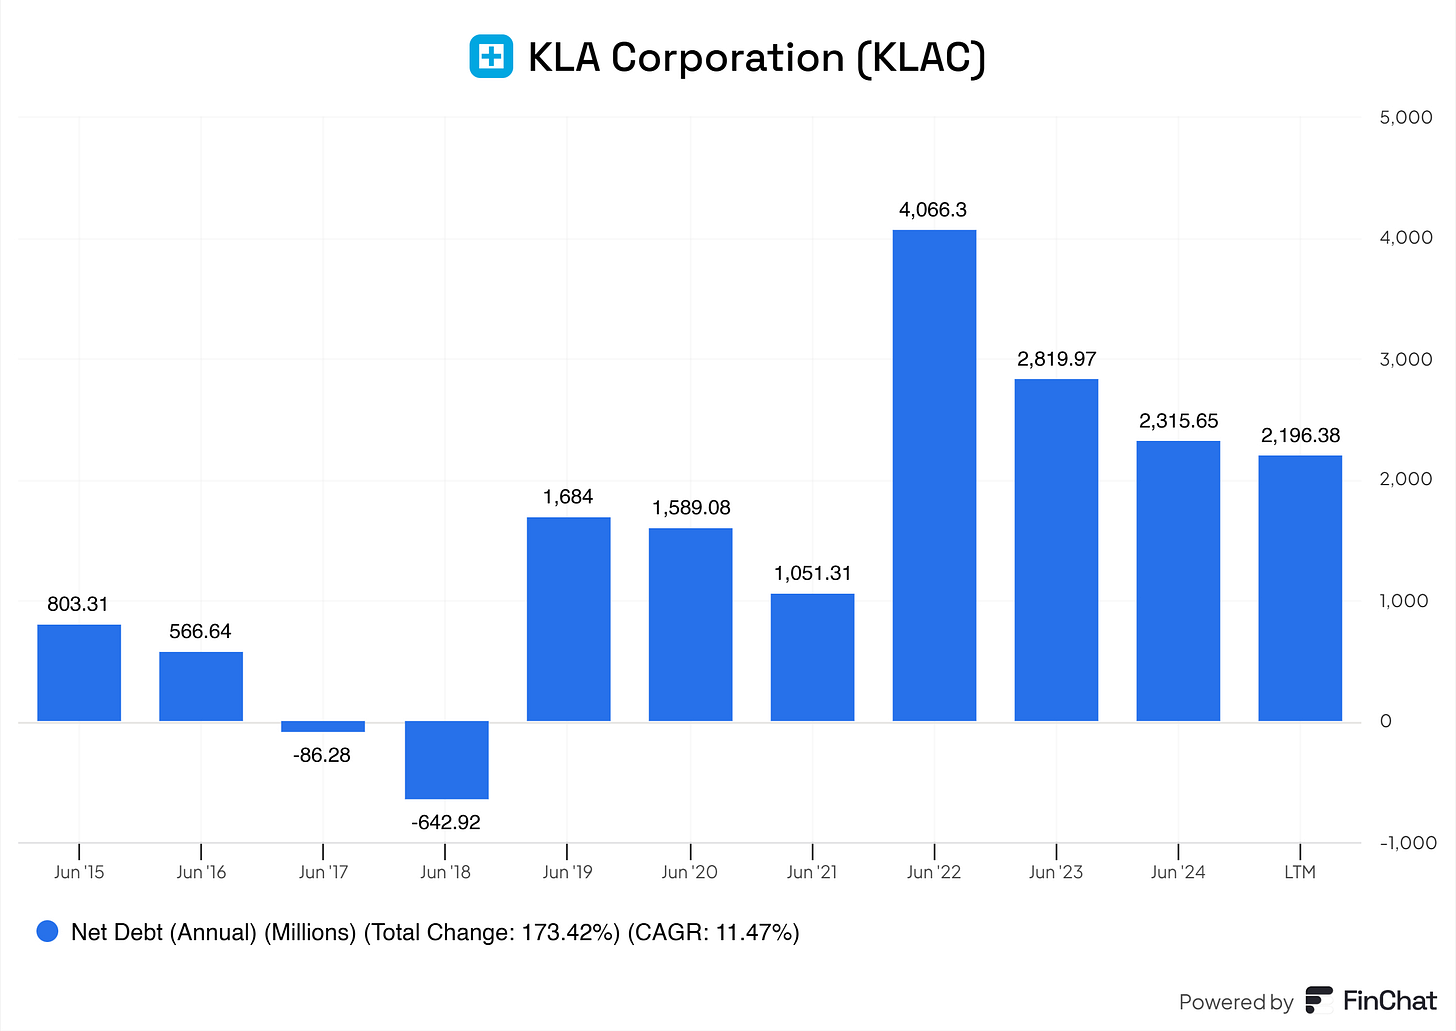
Net Debt
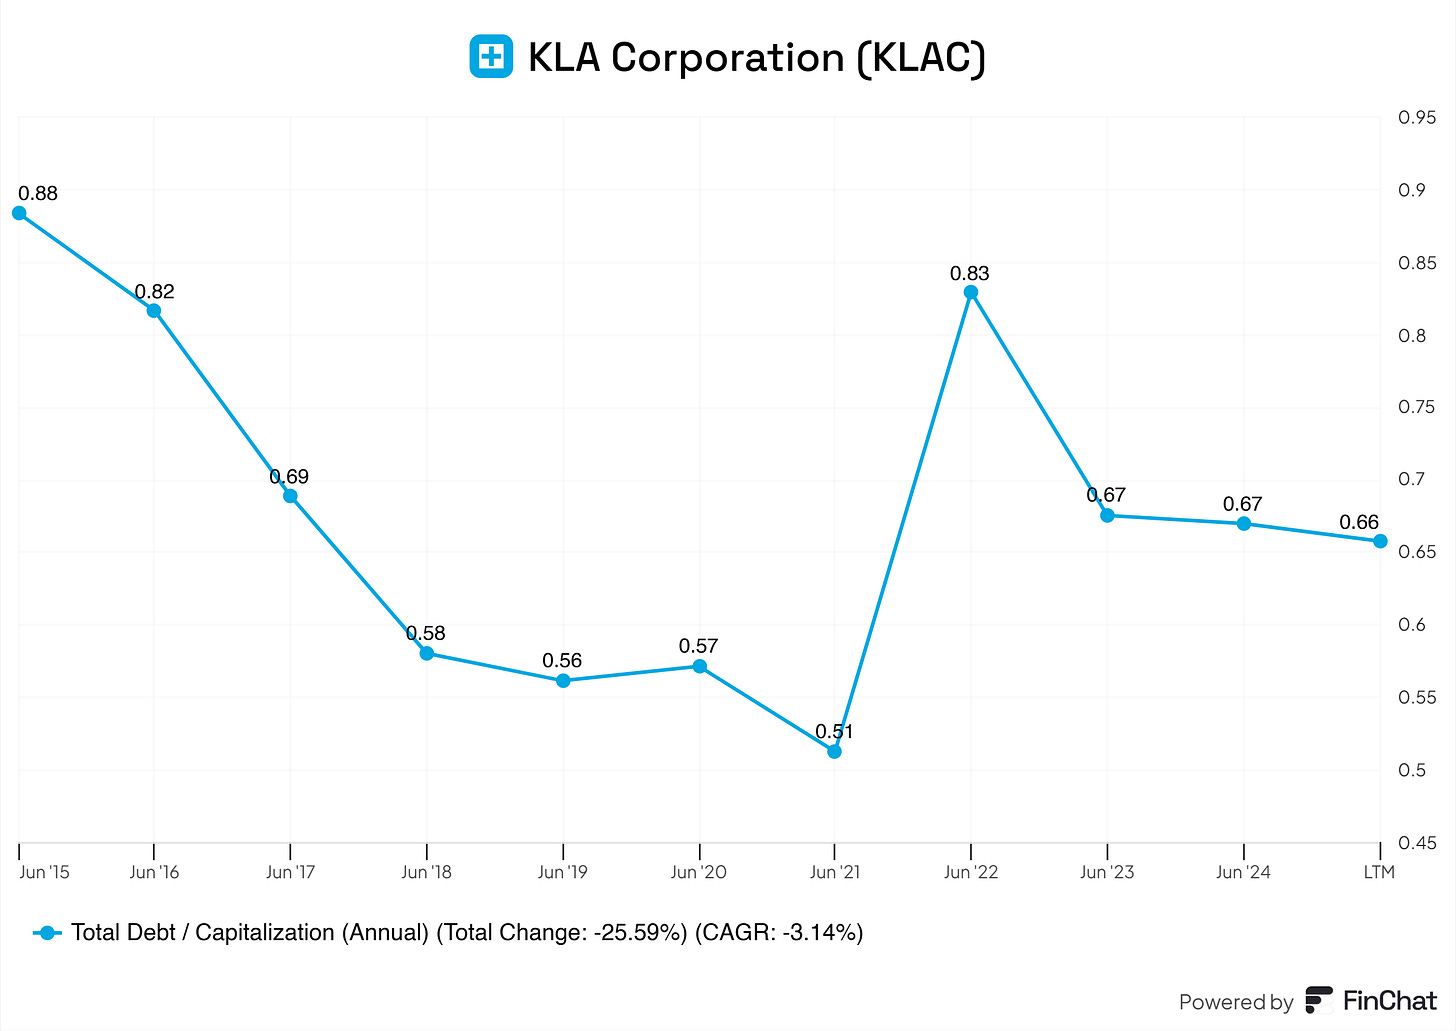
Total Debt / Capitalization
Let us go over them one by one in short:
Current Ratio
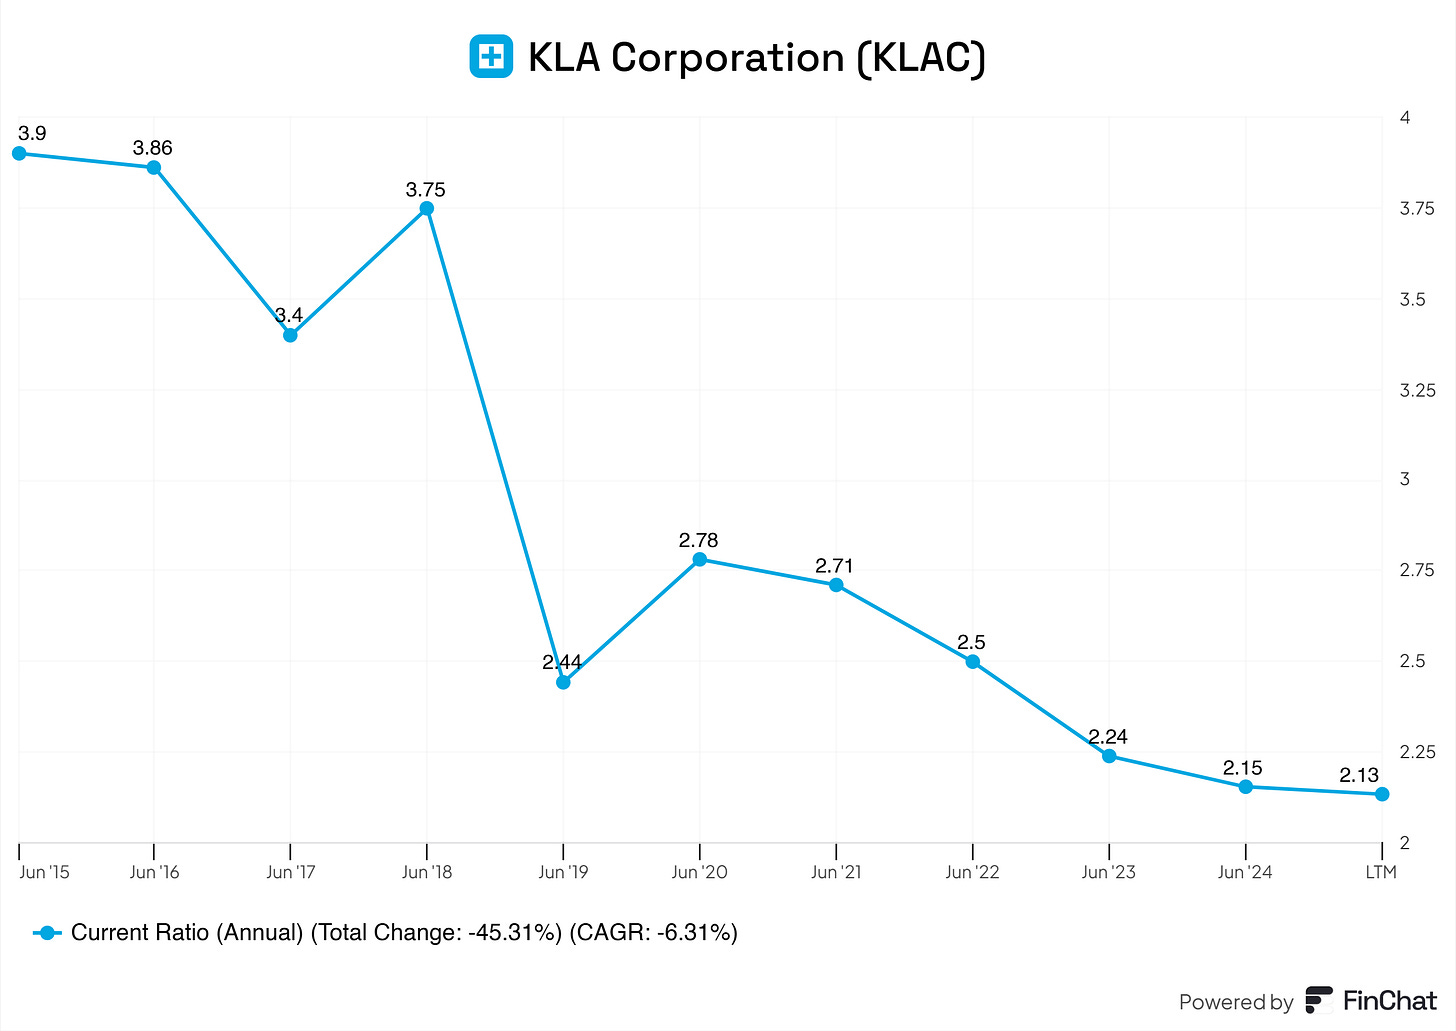
KLA's current ratio remains healthy, consistently above 2.0 in recent years, indicating strong liquidity. This ensures the company can comfortably cover short-term liabilities with its current assets, providing a safety net in uncertain times.
Debt/Equity
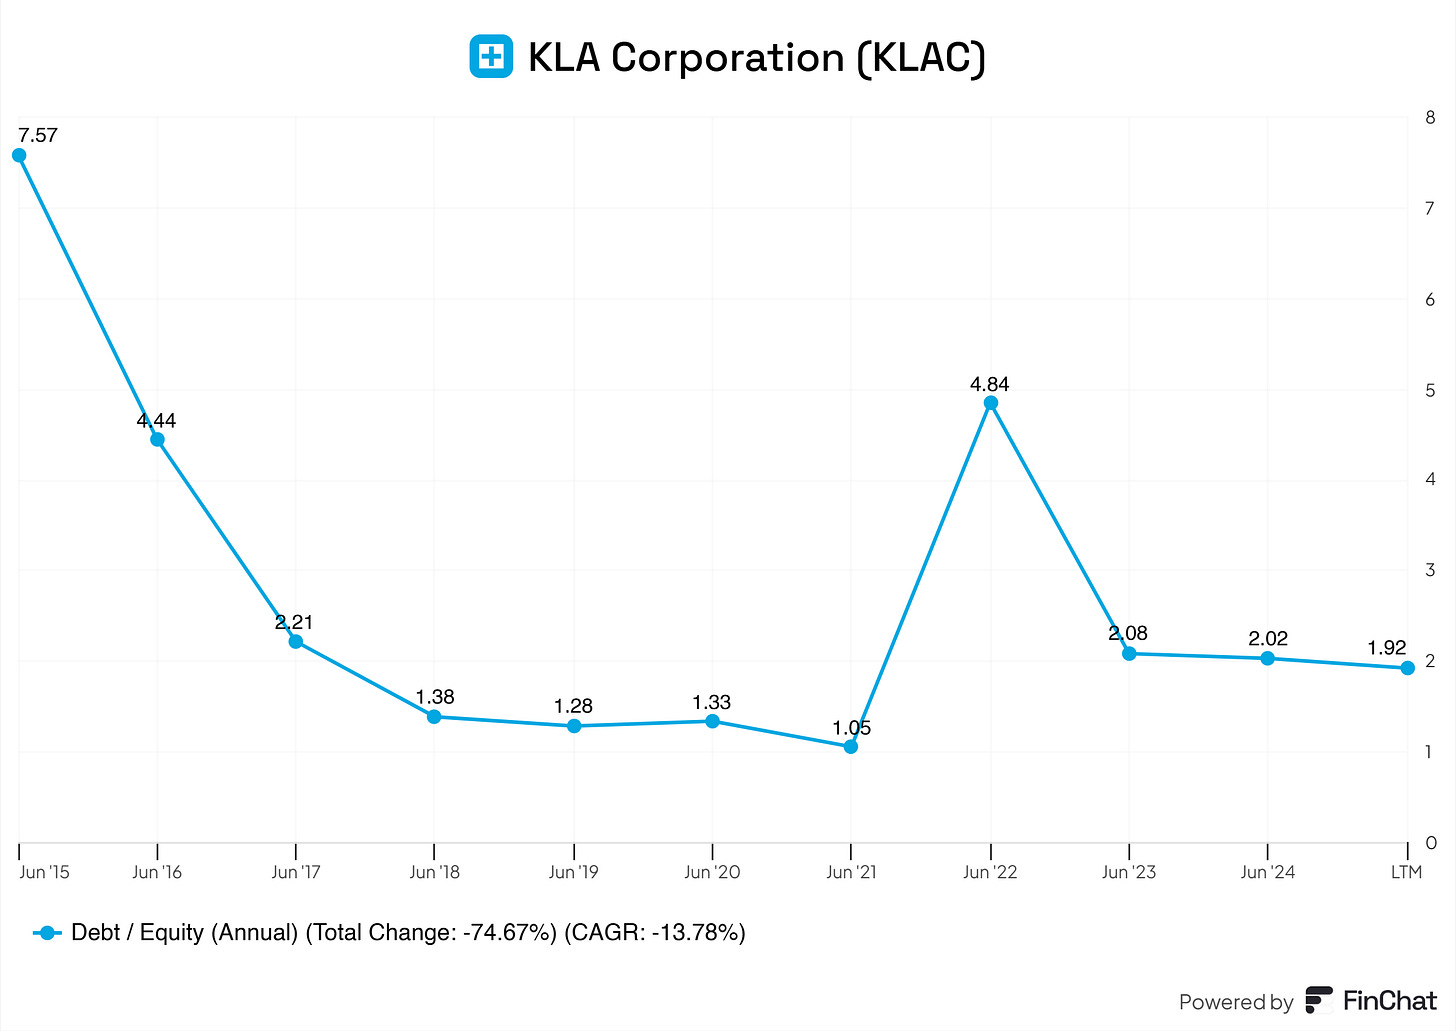
The debt-to-equity ratio has stayed somewhat between 1.20 and 2.05, reflecting a balanced approach to financing. This manageable leverage highlights financial stability while still utilizing debt effectively to fuel growth.
Net Debt/EBITDA
With a ratio near 0.5–1.0, KLA demonstrates excellent debt sustainability. This means the company can repay its net debt in about one year or less using its EBITDA, showcasing strong financial health.
EBITDA/Interest Expense
KLA’s EBITDA covers interest expenses over 16 times, indicating ample profitability to service debt. This high coverage reassures investors of KLA’s ability to meet its obligations with ease while maintaining operational growth.
Cash Flow to Debt Ratio
The improving cash flow-to-debt ratio (e.g., 0.49 LTM) signifies KLA’s growing capacity to repay debt using its operational cash flows. This metric highlights its efficiency in managing debt relative to cash generation.
EBIT/Interest Expense
With EBIT covering interest expenses over 12 times, KLA shows exceptional profitability and debt management. This allows the company to allocate resources for growth and shareholder returns confidently.
Net Debt
While rising slightly, KLA’s net debt position remains well-covered by EBITDA and cash flow. This indicates disciplined borrowing and sufficient capacity to manage obligations without over-leveraging.
Total Debt/Capitalization
The total debt-to-capitalization ratio of ~0.67 reflects a prudent use of debt in the capital structure. It strikes a good balance between leveraging debt for growth and maintaining financial stability.
KLA’s financial metrics reflect strong liquidity, controlled leverage, and excellent debt coverage, making it a well-managed and financially secure company that offers confidence to its investors.
8. Capital Structure
8.1 Expense Analysis
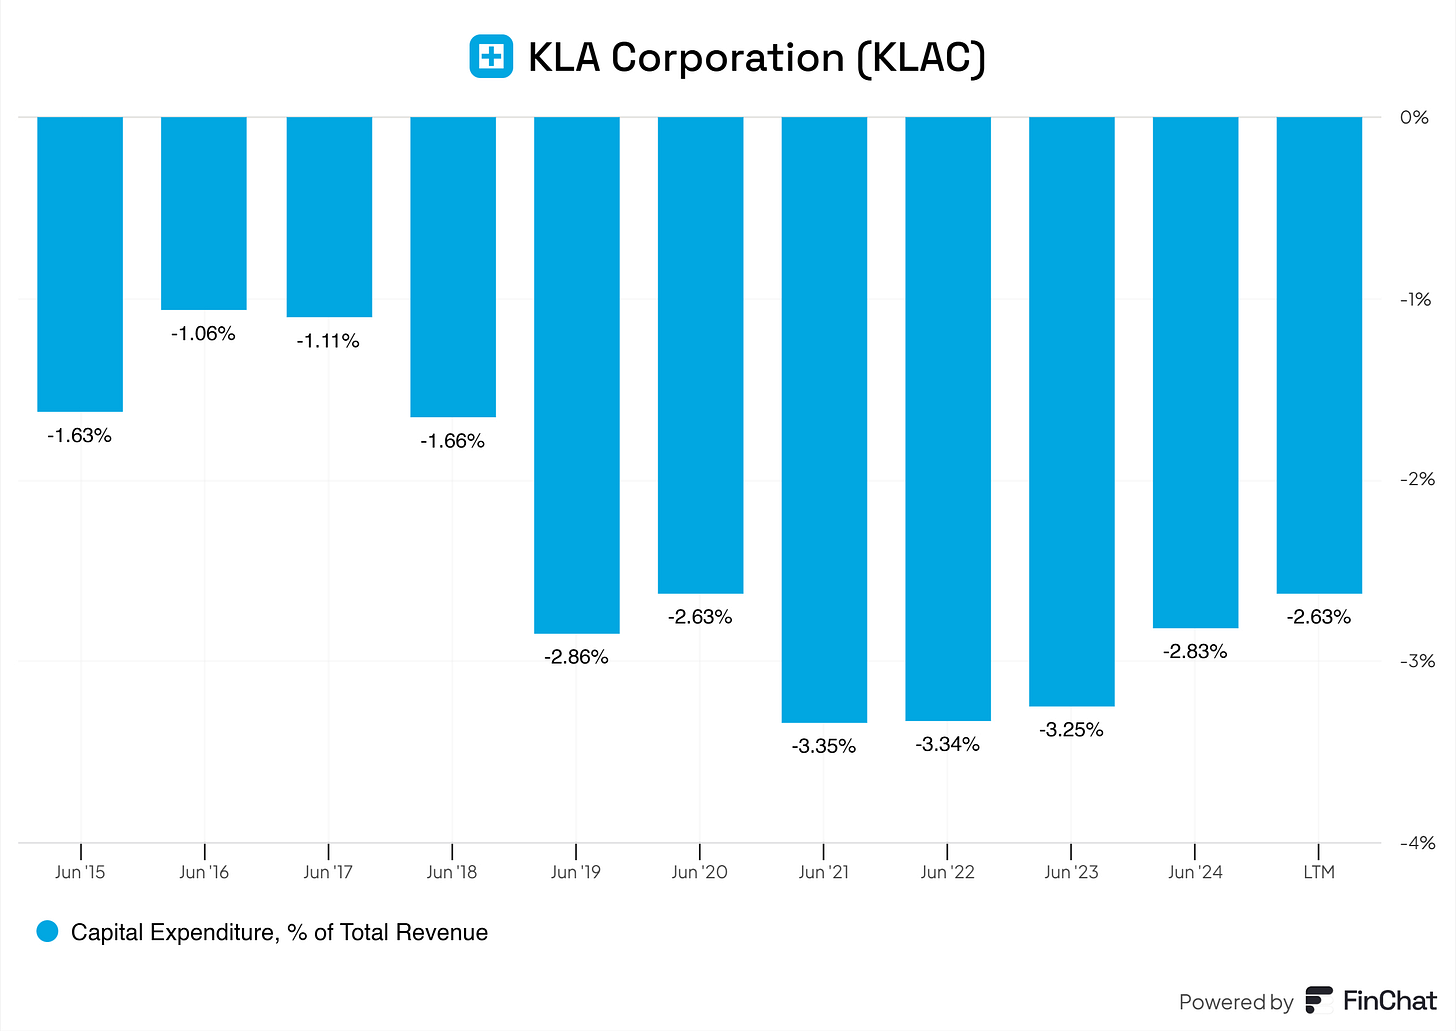
In recent years, CapEx is consistently around 2.63% to 3.35% of revenue.
Industry Benchmark: Semiconductor equipment companies like Applied Materials, Lam Research, or ASML typically have 3-5% CapEx-to-revenue ratios.
Observation: KLA’s CapEx is slightly below industry norms, which suggests they are efficient in managing their capital investments or potentially less aggressive in expanding physical capacity.
R&D expenses have steadily decreased from 18.46% (2015) to ~12.6% (LTM).
Industry Benchmark: Most peers in the semiconductor equipment industry spend 12-18% of revenue on R&D.
Observation: In recent years, KLA has been near the lower end of this range. While this might suggest strong operational efficiency, it could also indicate less focus on innovation than peers like ASML, which often invest heavily in R&D for cutting-edge technology.
COGS as a percentage of revenue is stable at around 40%, up from ~36% in 2016.
Industry Benchmark: COGS in the semiconductor equipment industry can range from 35-45% of revenue.
Observation: KLA operates in the middle of this range, suggesting a competitive but not standout cost structure for its production processes.
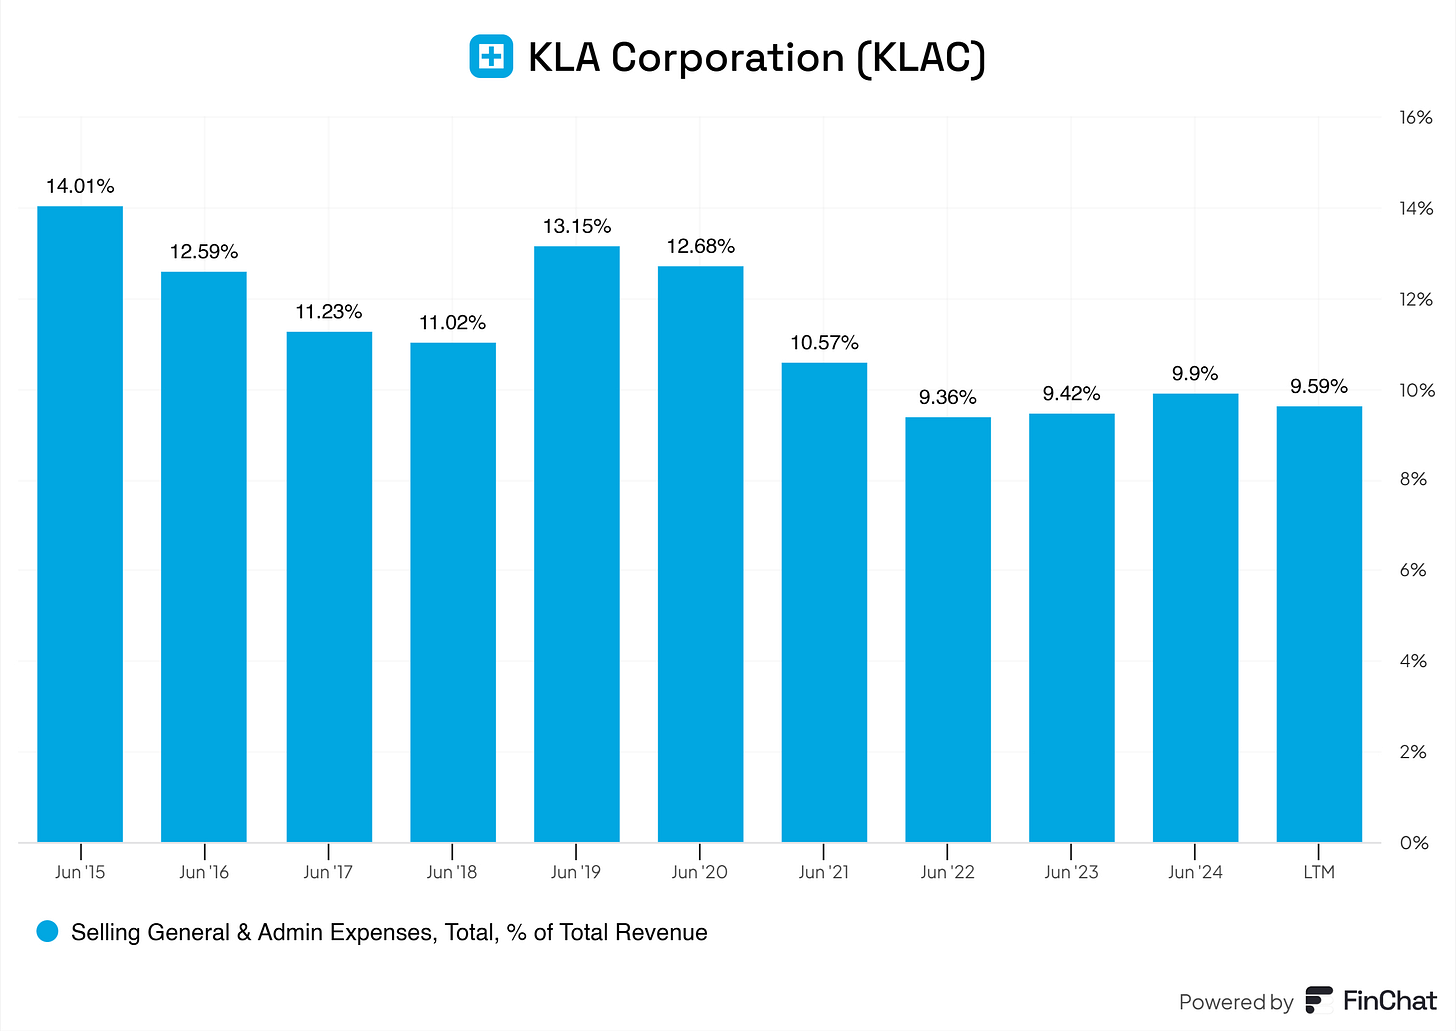
SG&A expenses have declined significantly, from 14% (2015) to ~9.6% (LTM).
Industry Benchmark: SG&A typically ranges from 8-12% of revenue for the semiconductor industry.
Observation: KLA’s SG&A efficiency is impressive, suggesting strong cost control in marketing and administrative overhead areas.
KLA stands out with low SG&A and is a strong indicator of operational discipline. While slightly lower on the R&D side, their R&D spending aligns with the industry norm, which is good. KLA’s CapEX is controlled reinvestment without overextension and is excellent across the board.
8.2 Capital Efficiency Review
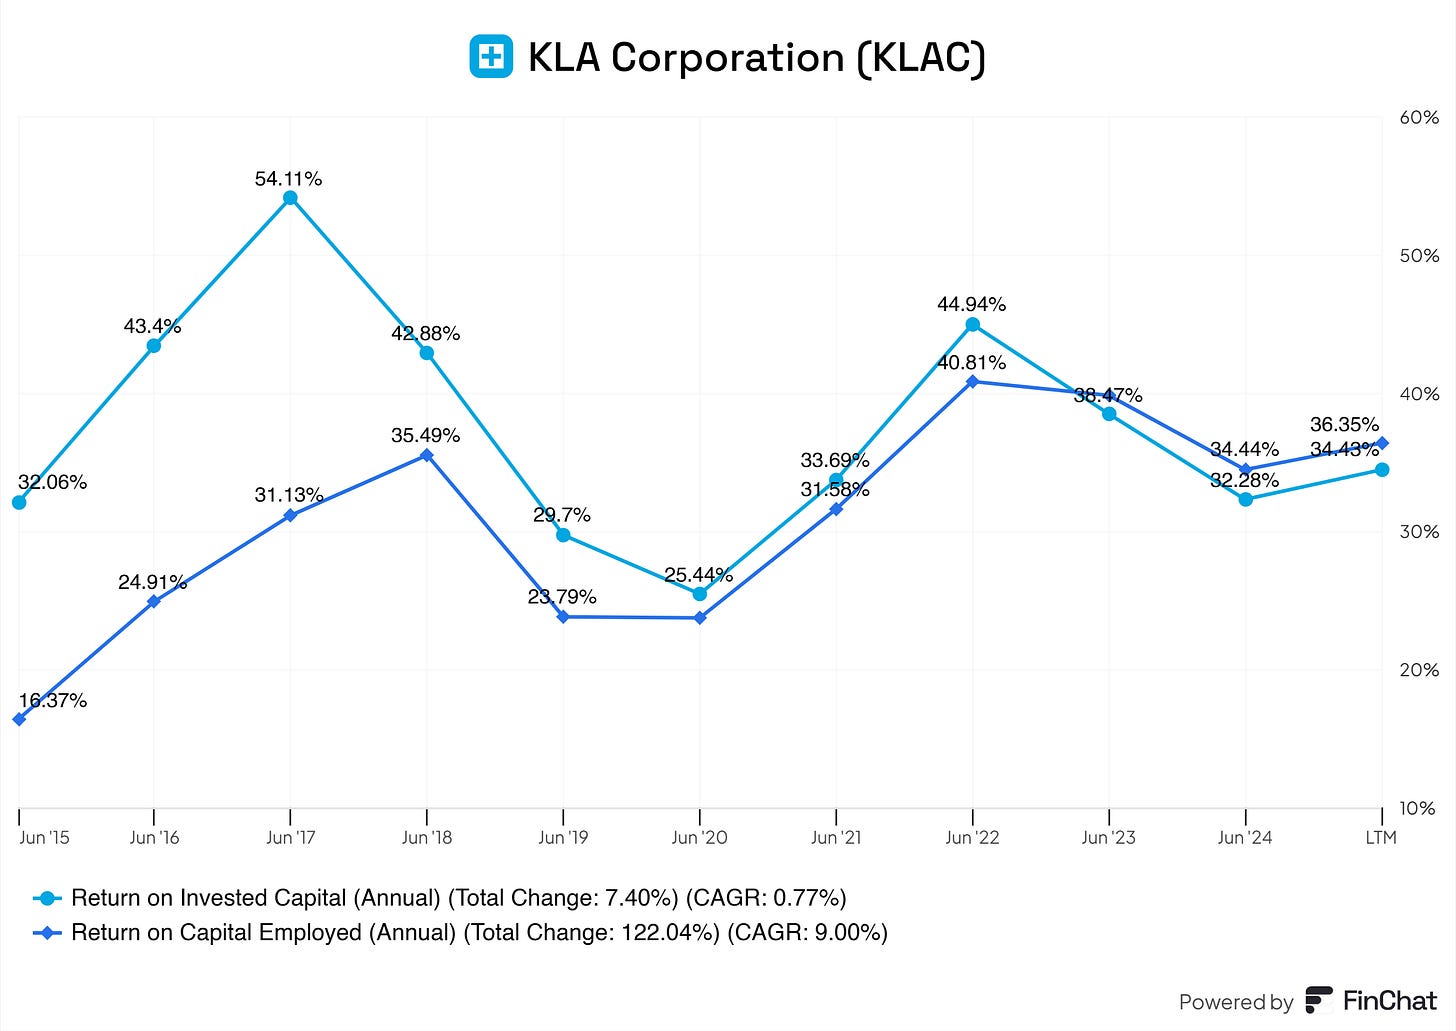
This graph must be one of the most beautiful I’ve seen.
KLA can reinvest cash into the business and have high returns. For every dollar of equity KLA reinvests into the business, they get roughly $1.36 back. KLA is extremely capable of investing in highly profitable projects. This return is once again reinvested into the business, making it compound. KLA is an absolute compounding machine.
An example with $1:
If KLA maintains an ROIC of 36.35%, an initial $1 investment would be compounded to approximately $4.71 over 5 years. This demonstrates the powerful impact of high ROIC on long-term value creation.
Now, with KLA, we’re talking about MILLIONS with a M!
9. Profitability Assessment
9.1 Profitability, Sustainability, and Margins
KLA has consistently demonstrated robust profitability and sustainable growth, evidenced by its expanding margins and revenue trajectory. Over the years, the company has maintained a strong gross profit margin of 57% to 64%. This stability reflects effective control over COGS and strong pricing power, key indicators of a well-managed, profitable enterprise.
The operating margin has significantly improved, from 24.62% in 2015 to approximately 37.58% in the latest period—a total increase of 52.59%! Such growth highlights KLA's ability to achieve economies of scale and maintain operational efficiency as its revenue grows.
Net profit margin has been particularly noteworthy, growing from 13.01% in 2015 to around 28.92% in the latest period, a total increase of 122.27%(!!). The company's ability to translate revenue growth into consistent bottom-line performance underscores its disciplined cost management and strategic focus on profitability.
KLA’s financial sustainability is evident in its consistent revenue growth, which expanded from $2.81 billion in 2015 to $10.26 billion in the latest period, a total growth of 264.49%. Isn’t that excellence, or what? Such performance reflects strong demand for its products and services and its ability to capture market share in the competitive semiconductor industry.
The company’s stable and improving margins and significant revenue growth suggest that its business model is profitable and highly sustainable over the long term. With consistent reinvestment into innovation and operational improvements, KLA appears well-positioned to maintain its leadership and deliver value to shareholders.
9.2 Cash Flow Analysis
Businesses like ASML usually have inconsistent FCFs. With KLA, the picture is completely different.
Free Cash Flow is one of the most critical factors I consider when evaluating potential investments. Cash is the lifeblood of any business; it can make or break a company.
KLA boasts an impressive Free Cash Flow Margin of 30%. In simple terms, for every $1 KLA generated in revenue, $0.30 is converted into free cash flow. This is the cash KLA has "free to spend" however it chooses. It can be used to buy back shares, reduce debt, pay dividends, or reinvest in the business—or, theoretically, waste it (though that's unlikely with a company like KLA).
What sets KLA apart is not just its ability to generate free cash flow but the consistency and stability with which it does so. KLA is a true free cash flow powerhouse, providing a solid foundation for long-term shareholder value creation.
10. Growth Analysis
KLA's revenue has grown at a CAGR of 14.99% over the past several years, driven by strong demand for semiconductor equipment and increasing market share. Given the industry’s ongoing expansion due to advancements in AI, IoT, and 5G, a conservative estimate would project 10-12% annual revenue growth for the next five years. This accounts for potential cyclical slowdowns but recognizes KLA’s ability to weather downturns due to its market leadership and diversification.
Projection: Assuming a slightly conservative growth rate of 10-12% annually, KLA’s revenue could scale as follows:
FY 2024: $11.3 billion (10% growth)
FY 2025: $12.5 billion (11% growth)
FY 2026: $13.9 billion (11% growth)
FY 2027: $15.3 billion (11% growth)
FY 2028: $16.9 billion (10% growth)
Profitability Projections
Gross Profit Margin: Historically stable around 57-64%, KLA should maintain its strong GPM due to pricing power and operational efficiencies. Expect margins to hover near the 60% mark.
FY 2024: $6.8 billion (GPM on $11.3 billion revenue)
FY 2028: $10.1 billion (GPM on $16.9 billion revenue)
Operating Margin: With OM improving to 37.58%, continued operational efficiency and scale benefits should keep this above 35%, even in challenging market conditions.
FY 2024: $4.0 billion to $4.3 billionFY 2028: $5.9 billion to $6.4 billion
Net Profit Margin: Currently at ~28.92%, NPM may fluctuate slightly but should remain near 25-30%, driven by disciplined cost management and a favorable product mix.
FY 2024: $3.2 billion to $3.4 billionFY 2028: $4.7 billion to $5.0 billion
Free Cash Flow (FCF)
KLA’s FCF margin of 30% is exceptional and positions the company as a free cash flow machine. Over the next five years, with projected revenue growth and stable margins, FCF could grow at 10-15% annually. This provides flexibility for:
FY 2024: $3.4 billion (on $11.3 billion revenue)
FY 2028: $5.1 billion (on $16.9 billion revenue)
Expect annual FCF to scale in tandem with revenue, reaching upwards of $3.5–4 billion annually if growth persists.
Capital Expenditures (CAPEX)
KLA has maintained a CapEx-to-revenue ratio of 2.6-3.3%, which is conservative for a semiconductor company. This level of reinvestment supports maintenance and moderate growth. With revenue scaling, CapEx will likely increase slightly in dollar terms but remain below 4% of revenue, ensuring strong free cash flow generation.
FY 2024: $339 million.
FY 2028: $507 million.
Return on Invested Capital (ROIC)
KLA’s current ROIC of 36.35% is outstanding, reflecting its ability to generate exceptional returns on reinvested earnings. Assuming sustained profitability and disciplined capital allocation, ROIC should remain above 30%, barring significant changes in market conditions. This positions KLA as one of the most efficient players in the industry.
Return on Capital Employed (ROCE)
ROCE, while typically lower than ROIC, should be tracked closely, given KLA’s efficient use of both equity and debt. Expect ROCE to remain in the 20-25% range, showcasing KLA’s ability to deliver superior returns on its total capital base.
Earnings Per Share (EPS) Growth
Current EPS: $22.
Projected EPS Growth: Assuming a 13-15% CAGR, driven by revenue growth, margin expansion, and potential share buybacks, the EPS trajectory would look like this:
FY 2024: $24.86 to $25.30.
FY 2025: $28.10 to $29.10.
FY 2026: $31.77 to $33.46.
FY 2027: $35.91 to $38.48.
FY 2028: $40.56 to $44.22.
11. Value Proposition
11.1 Dividends Analysis
KLA pays out a solid dividend, but you wouldn’t invest in this business for its dividend. With a dividend yield of 1.05%, it is not something interesting if you’re looking for dividends.
But, KLA returns shareholder value via share buybacks.
It seems like KLA is planning on continuing their dividends and keep hiking it!
10.2 Share Repurchase Programs
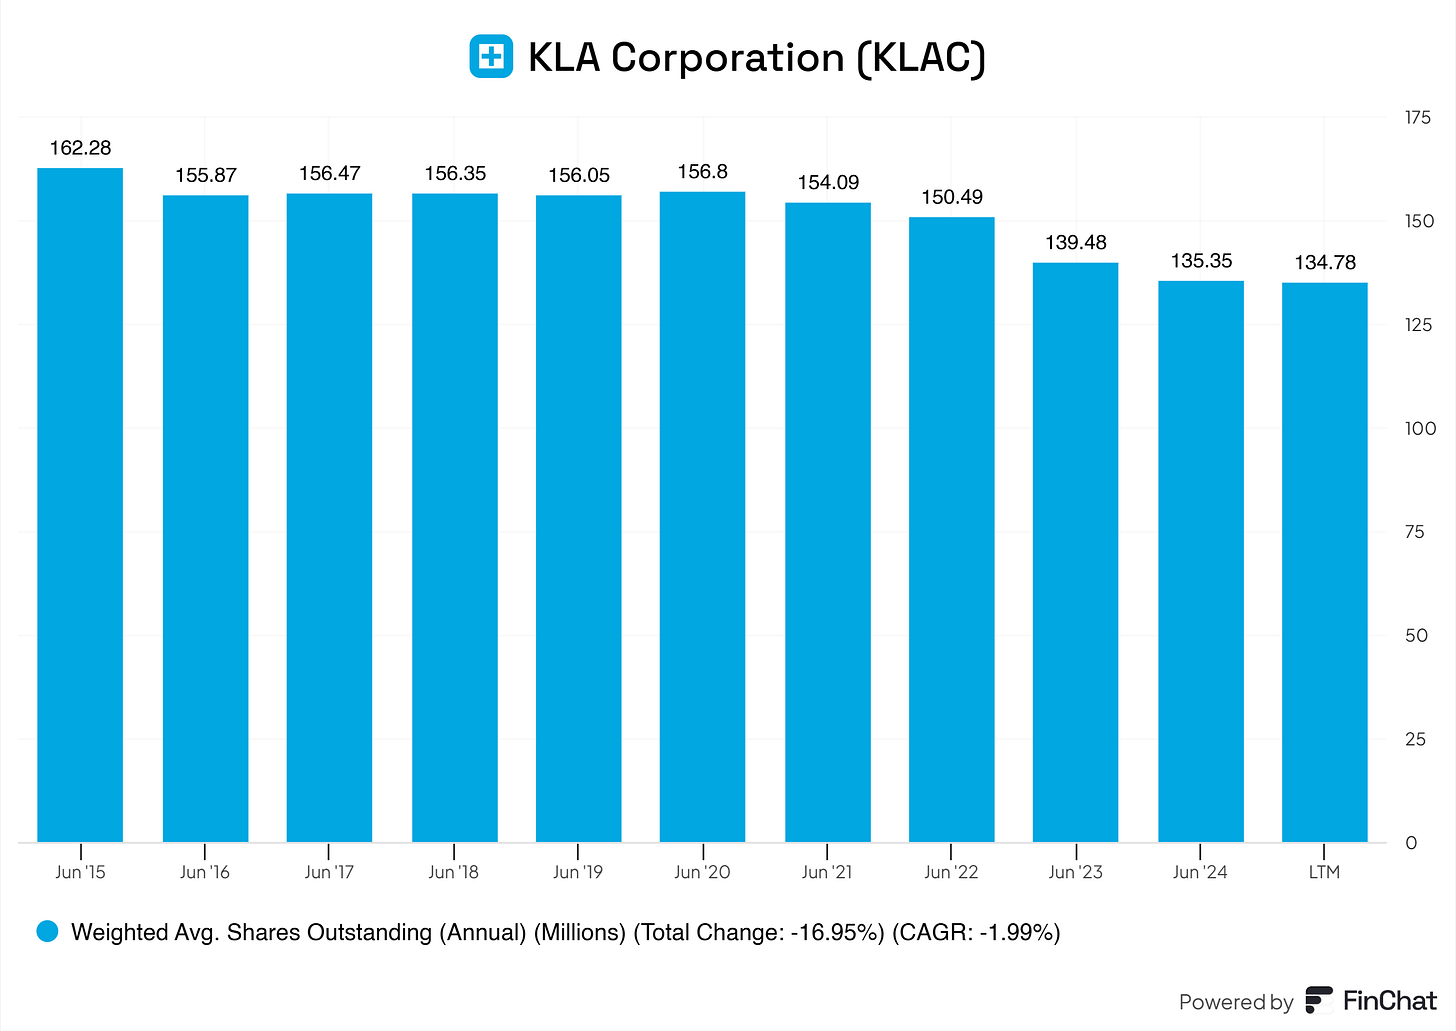
KLA is returning value by steadily decreasing its total outstanding shares. This means that YoY, you’re getting more on a per-share basis.
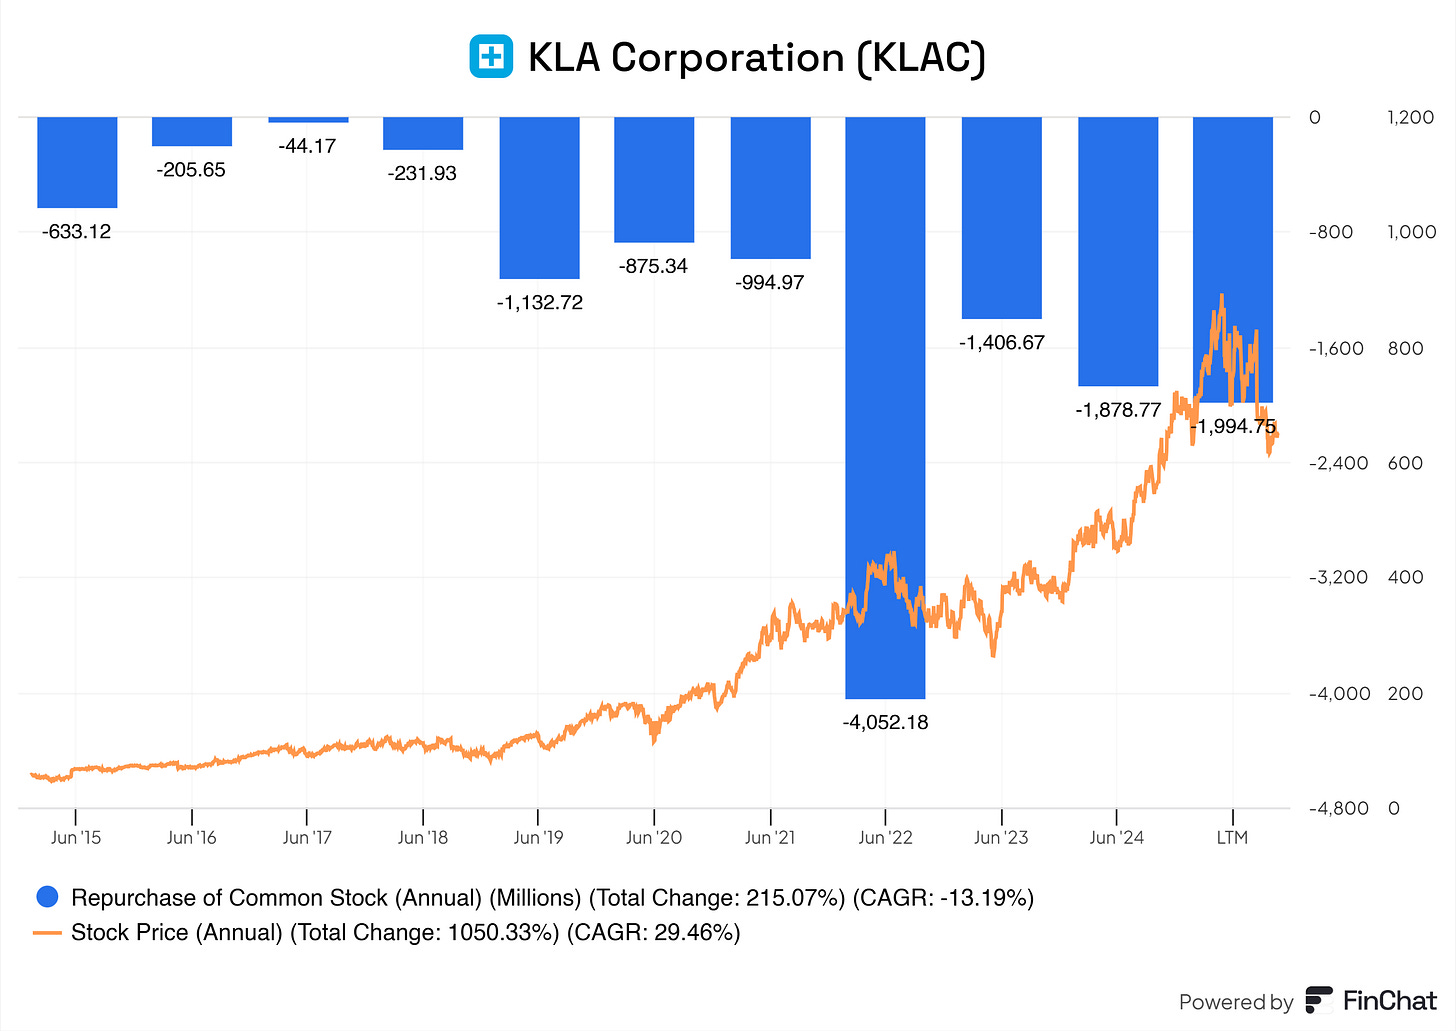
But, does KLA just randomly buy back shares, or are they actually looking at the intrinsic value of their business and strategically buying back shares?
I would say 50/50 here. In 2022, KLA bought shares back at a peak. Looking at the valuations back then, KLA wasn’t particularly cheap. Right now, with the drop in price and valuation, KLA seems to be taking the benefits here and buying back shares at a more favorable price, It's lovely to see.
And KLA is not done here, they’re dedicated on retuning shareholder value according to their latest earnings release.
Currently, 1.619 remaining shares are eagerly waiting to be picked up by KLA.
11.3 Debt Reduction Strategy
KLA has taken on more debt, but nothing the business can not handle.
12. Quality Rating
13. SWOT Analysis
14. Valuation Assessment
Let us crunch some numbers!
DCF: $854.44
Multiple Valuation: $700.83
Benjamin Graham’s Valuation: $739.70
Analysts Average: $776
Average of: $767,74
Current Price: $646.6
With this average and a margin of safety of 15%, KLA seems a solid buy!
(Do your own calculation; don’t follow mine blindly)
According to the reverse DCF, KLA must grow by 11.8% for this price range in the next 10 years. This tells me that KLA is undervalued at its current price point!
End note
Thank you for reading this investment case on KLA Corporation!
With every investment case, I am trying to improve my writing and how I communicate my findings with you all. Because I started not too long ago, some posts might change in layout or other aspects before I find the design that suits my best wishes; sorry in advance.
As of now, thank you so much for your time! I hope you found some valuable information in this investment case.
Disclaimer
I do not own KLA Corporation shares and do not intend to buy any within the next six months.
By reading my posts, being subscribed, following me, and visiting my Substack, you agree to my disclaimer. You can read the disclaimer here.
















I’m thinking of starting a small position around 620 usd. I was wondering why you’re not considering buying the stock. It seems the quality is there and the valuation seems reasonable.