O'Reilly Automotive- The Automotive Parts Winner or Loser?
O'Reilly Automotive has a 20-year CAGR of 22.44% based on its stock price. But, can we expect this to continue and see O'Reilly Automotive dominate or is this the next loser?
Hey there, partner! 👋🏻
I have been researching the automotive industry in the U.S.A. for a while now, and one name kept popping up on my screen, ‘‘O'Reilly Automotive’’. After seeing this name popping up everywhere I went, I had to dive into this business to learn more.
O'Reilly Automotive has been dominating the automotive aftermarket for decades. But can we expect O'Reilly Automotive to keep up its dominance, or should we note that there might be underlying issues for or in the business?
In this investment case, we peel back all the layers of O'Reilly Automotive to determine if it’s a high-quality business or a business we investors should avoid.
A little spoiler: O'Reilly Automotive is a high-quality business run by competent management with excellent growth on the horizon. If you want to find out why, continue reading. If you’re only interested in my valuations, scroll to the bottom. If you’re interested in other parts of the business, check out the table of contents. 😁
Before we begin, if you’re interested in more investment cases, check out previous investment cases I’ve written. I’m convinced these will add tremendous value to you and your portfolio.
Let’s dive into this investment case without taking more of your time.
Table of contents
Corporate Analysis
1.1 Business Overview
1.2 Revenue BreakdownExecutive Leadership
2.1 CEO Experience
2.2 Employee Satisfaction Ratings
2.3 CEO Value CreationInsider and institutional ownership
Competitive and Sustainable Advantages (MOAT)
Industry Analysis
5.1 Current Industry Landscape and Growth Prospects
5.2 Competitive LandscapeRisk Assessment
Financial Stability
7.1 Asset Evaluation
7.2 Liability AssessmentCapital Structure
8.1 Expense Analysis
8.2 Capital Efficiency ReviewProfitability Assessment
9.1 Profitability, Sustainability, and Margins
9.2 Cash Flow AnalysisGrowth Projections
Value Proposition
11.1 Dividend Analysis
11.2 Share Repurchase Programs
11.3 Debt Reduction StrategiesQuality Rating
Valuation Assessment
1. Corporate Analysis
1.1 Business Overview
With this business overview, I ask myself, ‘‘Do I understand how the business operates and how it generates its revenues?’’. I’ll keep it short and simple: the way we approach investing.
O'Reilly Automotive provides new and remanufactured automotive hard parts and maintenance items, such as alternators, batteries, brake systems components, belts, chassis parts, etc. O'Reilly Automotive is currently the leading auto parts retailer in the U.S.A., serving both professional mechanics and DIY (Do It Yourself) customers.
O'Reilly Automotive has roughly 6.291 stores across the U.S., Mexico, and Canada.
1.2 Revenue Breakdown
In this segment, we peel back the layers of O'Reilly Automotive's revenue streams.
This way, we clearly show how O’Reilly Automotive makes its revenue and where it comes from.
O'Reilly Automotive has three primary streams of revenue. Let’s go over them.
Professional Serice Provider Revenue (PSP)
This is revenue generated from selling parts, tools, and services to mechanics, repair shops, and other automotive service companies.
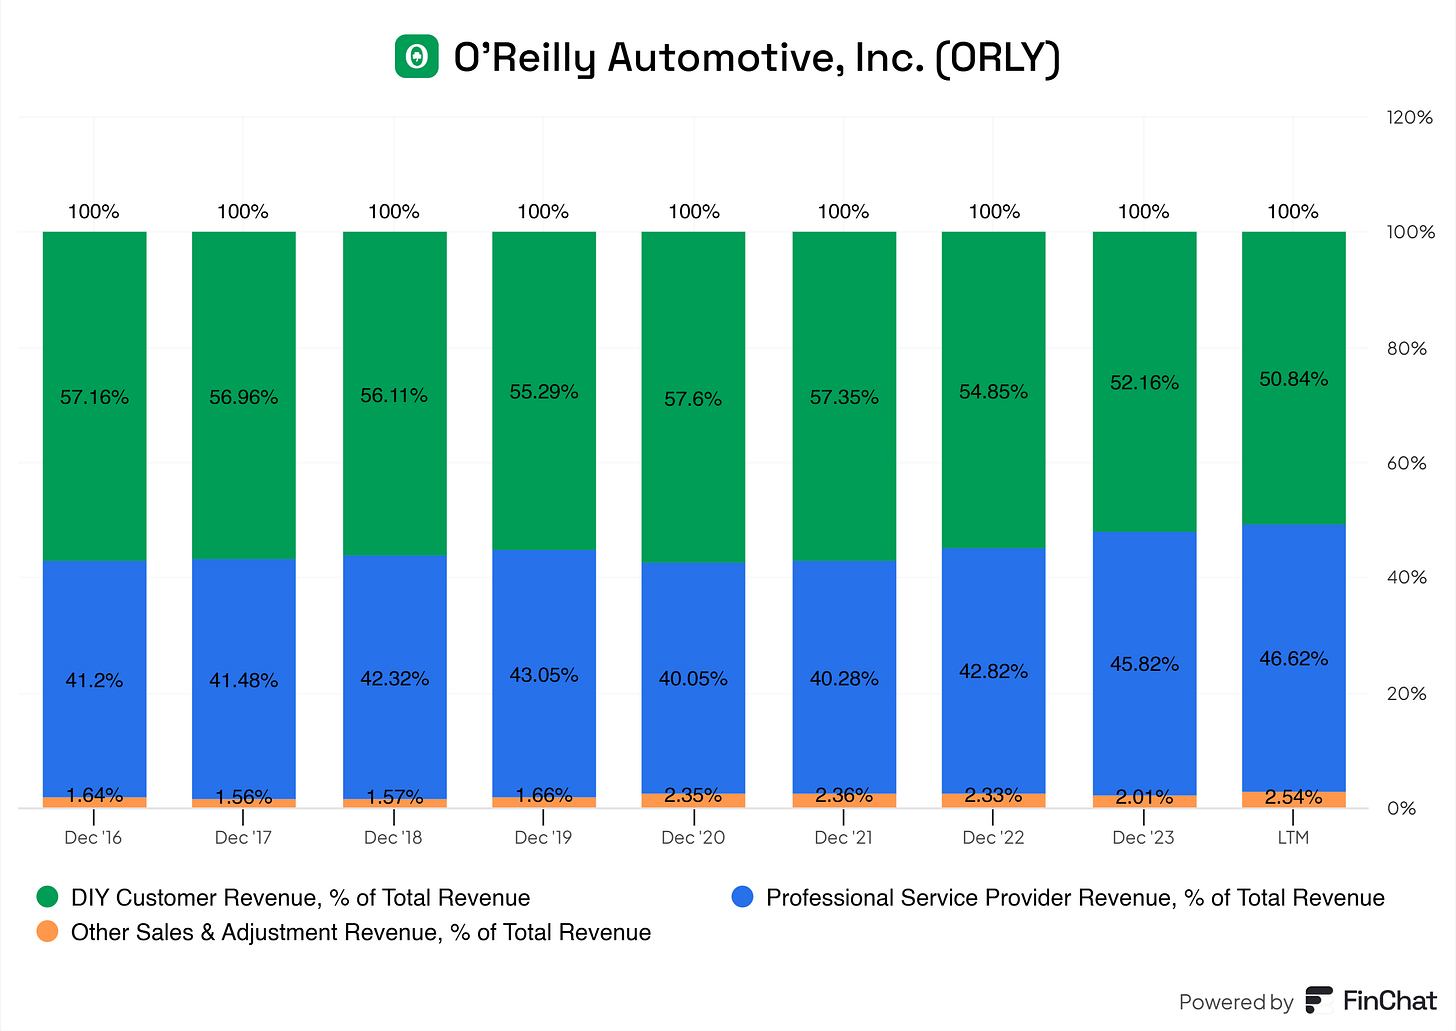
* This segment accounts for roughly 46.62% of O’Reilly’s Total Revenue (LTM)DIY Customer Revenue
This is revenue generated from individuals like you and me purchasing parts and tools for their own vehicle repair and maintenance.
* This segment accounts for roughly 50.84% of O’Reilly’s Total Revenue (LTM)Other Sales & Adjusted Revenue (this being the least important revenue driver)
This segment capitulates non-merchandise revenue, such as revenue from services such as equipment rentals, shipping fees, or other ancillary services provided to its customers.
* This segment accounts for roughly 2.54% of O’Reilly’s Total Revenue (LTM)
O’Reilly has a well-balanced portfolio of revenue streams here; nothing to complain about. The spread of these revenue streams has been stable as well. The DIY segment of O’Reilly has been stable in the mid-50 %, and the PSP segment of O’Reilly has been stable in the mid-40 %. We do not see any significant shift in these segments.
For the people who are better informed via graphs, like me, here are the segments in comparison to O’Reilly’s Total Revenue (P.S. I’m a visual learner, and so are many others; there's nothing wrong with that, haha.)
While breaking down O’Reilly’s revenue, it is also good to note which countries the revenue comes from. Revenue diversification is good, and so is global diversification. Unfortunately, in the case of O’Reilly, their earnings are consolidated into one segment, making it impossible for me to estimate what revenue comes from what part of the world. We could guesstimate, but we prefer cold-heart facts instead of estimates regarding O’Reilly’s revenues.
Let us go over, in short some other KPIs of O’Reilly Automotive, which are extremely important as well.
New Stores
O’Reilly still is opening a significant amount of stores in the US. In 2021 165 stores opened, in 2022 170 stored opened, in 2023 166 stores opened and LTM 124 stores have opened. In Mexico, we see that YoY O’Reilly is opening more stores. In 2019 21 stores opened, in 2020 1 store opened, in 2021 3 stores opened, in 2022 17 stores opened, in 2023 20 stores opened and LTM 30 new stores opened.Comparable Store Sales Growth
For the people who need a refresher, comparable store sales growth is a metric that measures the performance of a company’s existing stores over a specific period, excluding sales from newly opened or closed locations.
If a retailer reports comparable store sales growth of 5%, its existing stores collectively sold 5% more than they did in the same period last year.
(formula: Comparable store sales growth = Current period sales - prior period sales / prior period sales x 100)
Here O’Reilly shows excellent numbers as well! In 2019, it was 4%; in 2020, it was 10.9%; in 2021, it was 13.3%; in 2022, it was 6.4%; in 2023, it was 7.9%.
Overall, the numbers here are wonderful for comparable store sales growth!Sales per Weighted-Average Store
is a retail metric that measures the average revenue generated by a company's stores during a specific period, adjusted for the time each store was operational. It accounts for store openings, closures, or relocations within the period to provide a fair representation of performance across the entire store network
For example, If a retailer has $1 billion in total sales and an average of 500 stores open throughout the year:
Sales per Weighted-Average Store = $1B / 500 = $2M. This means each store, on average, contributed $2 million in revenue.
In 2019 this was $1.88M; in 2020, this was $2.06M; in 2021, this was $2.3M; in 2022, this was $2.42M; and in 2023 this was $2.58M
2. Executive Leadership
2.1 CEO Experience
Management culture is extremely important to me and should also be important to you.
Why?
In the long run, management and culture drive high(er) investment results for both investors and the business.
The current CEO of O’Reilly’s is Brad Beckham.
Brad Beckham has been part of O’Reilly since 1996. He started as a Parts Specialist and progressed through multiple roles, from Store Manager, District Manager, Region Director, and Vice President to becoming the running CEO of O’Reilly.
Brad Beckham has been part of O’Reilly for a whopping 28 years. He started at O’Reilly when he was only 17 years old after graduating from high school only two weeks prior
“I didn’t think college was for me,” Beckham says, “but I had a ‘68 Camaro and a dirt track car, and I loved DIY projects. O’Reilly had the best parts people, and I assumed it would be a really cool job.”
Brad Beckham started from the bottom of the chain and worked his way up. Brad Beckham became the CEO of O’Reilly in February of 2024, recently. I think this is an excellent choice! Brad has knowledge from every aspect of the chain within O’Reilly due to his 28-year tenure at the business. Having someone like Brad at the wheels of the ship tells me there’s competent management with knowledge of his ship and the business, and his values should align with those of the business and its growth operations.
Brad Beckham currently owns roughly 0.00311% of the outstanding shares with a market value of roughly $2.2M. There’s not much skin in the game here, but with his past employment, I think we could look the other way here for once.
So, is there competent management at the wheels of O’Reilly Automotive?
Check! ✅
2.2 Employee Satisfaction Ratings
Building and sustaining a good satisfaction score with your employees does benefit the company in the long run. Having employees aligned with the strategy and aspirations of the business has proven to be one of the biggest foundations for company growth and success.
Luckily, we can find most of this information at Glassdoor and Comparably. Two wonderful sites that track the culture of (past) employees are decades, giving us a small sneak peek into the business and its culture.
52% would recommend O’Reilly Automotive to a friend
61% approve of the CEO Brad Beckham
These results are neither good nor bad; it’s in between. With O'Reilly's scale, we could expect this to be on the lower side, especially knowing that O’Reilly is experiencing explosive growth. To be fair, Brad recently became the CEO, so I suspect this score applies to the previous CEO, Greg Johnson. Maybe if we return in a couple of years, we can paint a clearer picture of Brad's impact on O’Reilly!
This is awful, cutting to the chase here. We’ve seen Tesla, Amazon, Lululemon, and many other businesses that are often bigger, scoring better.
With the O’Reilly scale, I was hoping for a better score for its culture, but I’m deeply disappointed. Yes, this score is gathered under Greg Johnson’s ‘ruling,’ so pointing at Brad Beckham would be out of the ordinary, but I truly hope Brad can turn this around for the business.
Let us check if O’Reilly’s management is better at creating value than a good working culture; I hope so!
2.3 CEO Value Creation
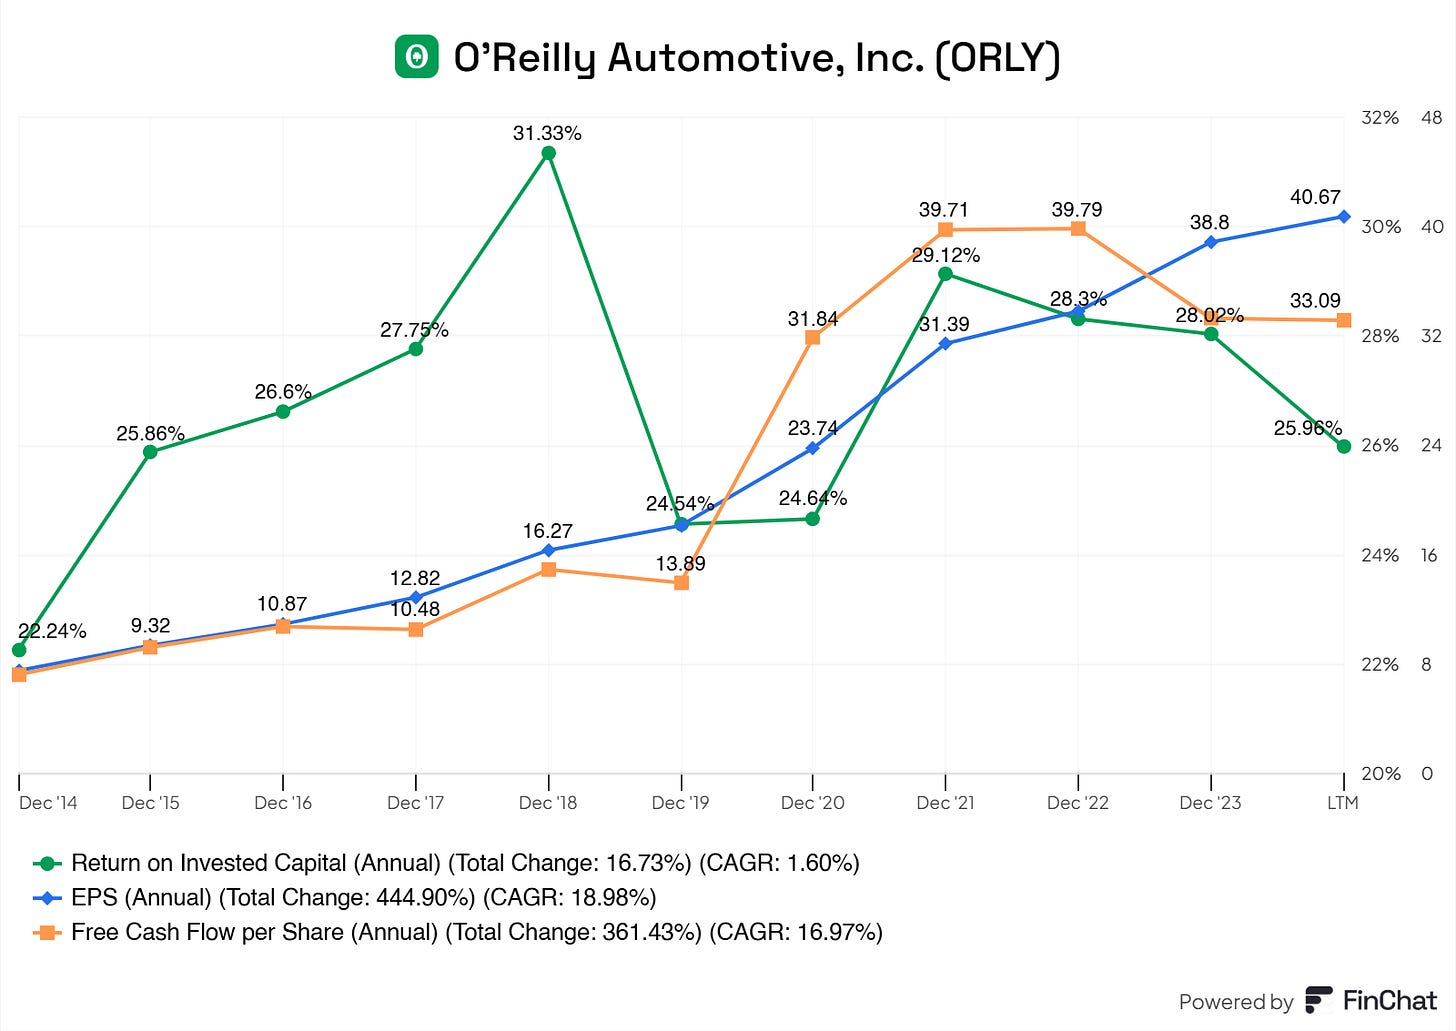
In short, yes! Management is creating value for its shareholders.
O’Reilly has consistently been showing excellent Return on Invested Capital (ROIC), Earnings Per Share (EPS), and Free Cash Flow Per Share (FCFPS).
3. Insider and institutional ownership
With a high-quality business, we would love to see that insiders have a big share of the pie or that insiders are buying shares.
Insiders sell for many reasons but buy for one — Peter Lynch
Insider buying typically signals their belief that the company’s stock is undervalued and its future prospects are strong, as they put their capital at risk.
The quote is debatable for institutions but indicates how they feel about the business.
So, what are insiders and institutions doing?
93.27% of the 57.73M outstanding shares are owned by institutions (that’s 53.95M shares)
0.55% of the 57.73M outstanding shares are owned by insiders (that’s 0.32M shares)
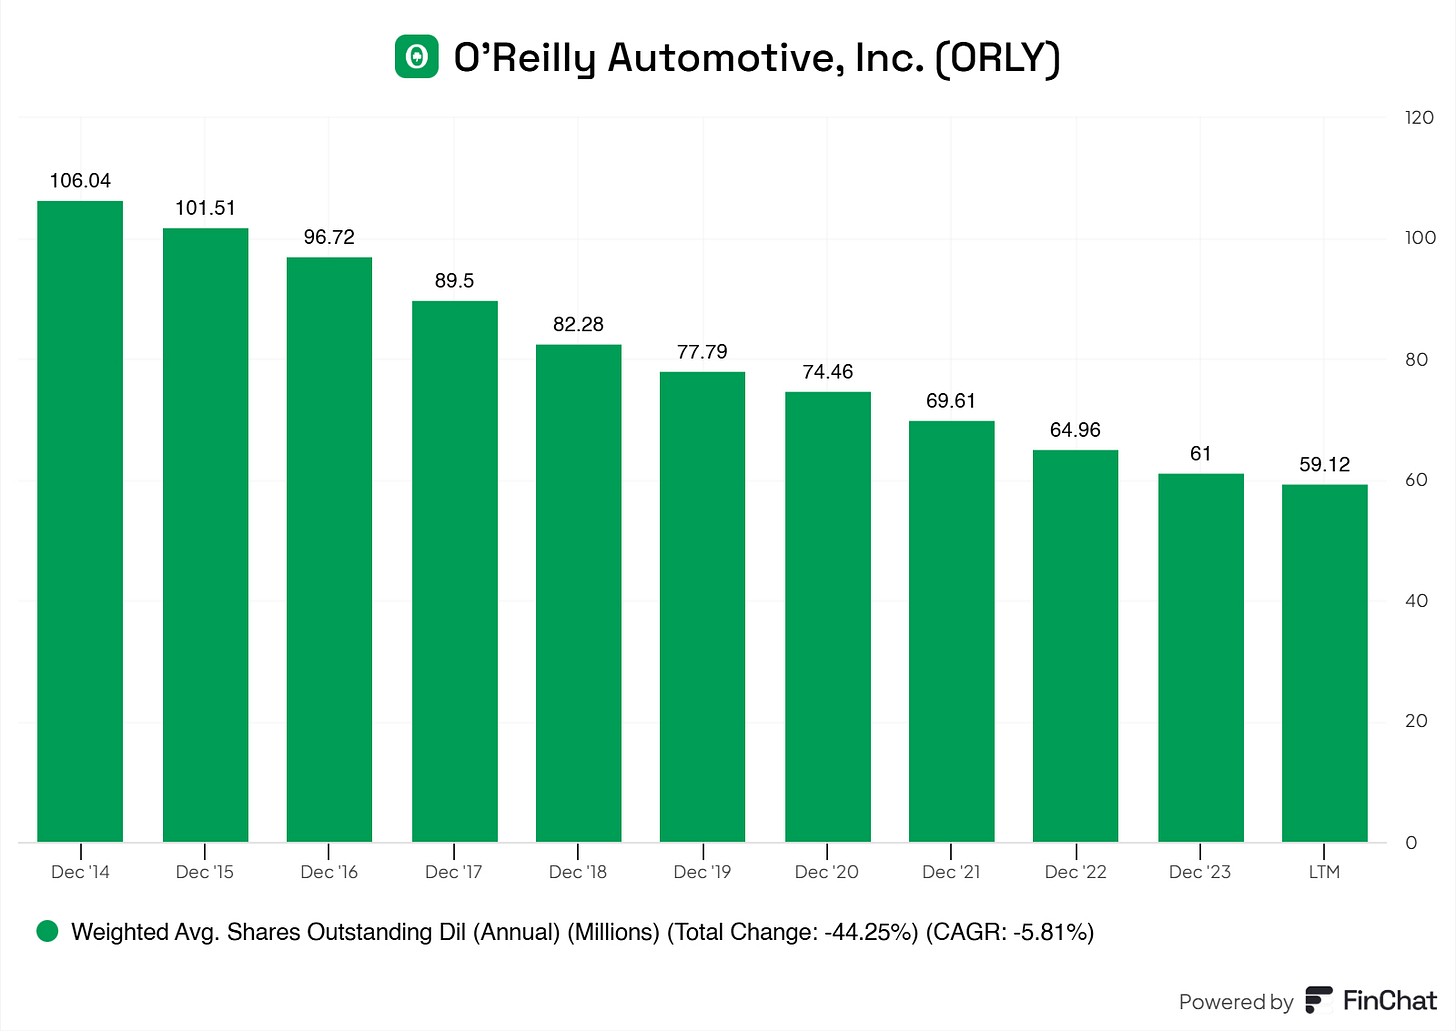
The total outstanding shares are steadily declining
Institutional ownership has been steadily increasing over the last couple of years
Insider ownership has been (unfortunately) steadily declining
Mr. David E. O’Reilly holds 34.54% of the insider shares
Mr. Lawrence P. O’Reilly holds 29.13% of the insider shares
Mr. Gregory L. Henslee holds 14.08% of the insider shares
Unfortunately, there’s limited skin in the game. But, with the expertise of management, I think, like I said previously, I should look the other way in the case of O’Reilly.
4. Competitive and Sustainable Advantage (MOAT)
So, a MOAT can be in either one or more of the following forms:
Brand Power
Patents
Scale and Cost Advantages
Switching Costs
Network Effect
Attracting Talent (I consider this a MOAT, others don’t. Decide for yourself)
Brand Power
O'Reilly has a powerful and well-established reputation as a trusted auto parts supplier for the DIY group, professional service providers, mechanics, etc. Its extensive store network and focus on customer services reinforce its brand.
Patents
O'Reilly doesn't rely on patents like Pfizer or Johnson & Johnson, as its business revolves around retailing and distributing automotive parts rather than proprietary technologies. In the automotive parts industry, competitive advantages come from logistics, customer relationships, and scale rather than intellectual property.
Scale and Cost Advantages
O'Reilly's size and extensive network give it a significant economy of scale. O'Reilly's ability to source parts at lower costs and distribute them efficiently allows for competitive pricing and better overall margins. The scale enables O'Reilly to offer a wider product range and maintain inventory availability, which (smaller) competitors tend to struggle to match.
Switching Costs
Some people argue that there might be switching costs for its PSP segment, with costs tied to relationships, delivery reliability, and account-based pricing. I’m 50/50 on this part.
In the DIY segment, switching costs are out of the picture since customers can shop elsewhere without obstacles.
Attracting Talent
O'Reilly’s reputation for customer service and technical expertise requires skilled and knowledgeable employees. The company invests in employee training and incentives, creating a MOAT by ensuring better in-store service than competitors. Skilled employees who can provide technical advice are key to building trust with PSP and DIY customers. Is this a big part of their MOAT? No, not really, but it helps. Things like this compound, too, you know.
O'Reilly’s competitive edge largely comes from its operational efficiency, brand reputation, and ability to scale effectively.
5. Industry Analysis
5.1 Current Industry Landscape and Growth Prospects
This research from Fortune Business Insights noted that the global automotive aftermarket size was valued at roughly $418.95 billion in 2023. According to this study, the market is projected to grow from $430.51 billion in 2024 to $568.19 billion by 2032, exhibiting a CAGR of 3.5% during the forecast period.
Here’s a quick summary of this research.
Key trends and growth factors
Aging vehicles
As vehicles age, they require frequent maintenance and replacement of components like brakes, tires, and batteries. In 2021, the average vehicle age in the U.S. reached 12.1 years, and similar trends are observed globally, fueling steady demand.E-commerce Expansion
Online platforms transform the aftermarket industry by offering convenience, product variety, and competitive pricing. Companies like Bosch have enhanced online tools, making it easier for customers to access product information and compatibility features.Electric Vehicles
The rise of EVs has driven manufacturers to develop specialized parts, such as EV-compatible tires and batteries, creating new growth opportunities.Consumer Preference for personalization
North American and European markets are particularly strong in demand for vehicle customization, including accessories and performance upgrades.
Challanges and restraints
Advanced vehicles technology
Increasing vehicle complexity poses challenges for independent repair shops, which may lack the specialized tools and knowledge required. OEMs often restrict access to diagnostic information, leading to a reliance on authorized dealerships.OEM warranties
Extended OEM warranties can limit demand for aftermarket products and services, especially for newer vehicles.
Regional Insights
North America
Largest market, driven by vehicle personalization trends and the aging vehicle fleet.Europe
Significant growth is due to older vehicles on the road and the high demand for replacement parts.Asia-Pacific
Rising vehicle ownership and economic growth contribute to market expansion.Rest of the World
Growth was driven by increasing vehicle fleets in emerging markets.
5.2 Competitive Landscape
O’Reilly Automotive’s main competitors are:
AutoZone, Inc. (Ticker: AZO)
Advanced Auto Parts, Inc. (Ticker: AAP)
Genuine Parts Company, Inc. (Ticker: GPC)
CarParts.com, Inc. (Ticker: PRTS)
LKQ Corporation (Ticker: LKQ)
Parts iD, Inc. (Ticker: ID)
Holley, Inc. (Ticker: HLLY)
P.S. click to expand the photo 😄
Return on Invested Capital (ROIC - 5-Year Avg): 27.29%
ORLY demonstrates exceptional efficiency in generating returns from its capital, only behind AutoZone (28.98%), making it a leader in this metric.
Return on Capital Employed (ROCE - 5-Year Avg): 50.14%
ORLY significantly outpaces all competitors, indicating superior operational efficiency and profitability on capital employed.
Gross Profit Margin: 51.21%
ORLY has one of the highest gross profit margins, reflecting its pricing power and cost management, just slightly behind AutoZone (53.09%).
Free Cash Flow Margin: 11.9%
ORLY excels in generating free cash flow, showcasing its ability to convert sales into cash while maintaining operational efficiency.
Diluted EPS Growth (5-Year CAGR): 18.42%
ORLY’s ability to grow earnings per share is among the best in the industry, reflecting consistent profitability growth.
Net Income Growth (10-Year CAGR): 12.3%
ORLY has a strong track record of growing net income over the long term, beating most competitors except CarParts.com (17.59%).
Where O’Reilly ‘falls behind its competitors’
Gross Profit Margin: Slight Lag Behind AutoZone
While ORLY’s gross profit margin is impressive, AutoZone edges ahead with 53.09% compared to ORLY’s 51.21%.
EBITDA Growth (5-Year CAGR): 11.01%
ORLY is middle-of-the-pack for EBITDA growth, trailing behind higher-growth competitors like CarParts.com and Holley.
Revenue Growth (5-Year CAGR): 10.5%
Although strong, ORLY lags slightly behind faster-growing competitors like CarParts.com (17.54%) and AutoZone (9.28%).
6. Risk Assessment
Although the automotive industry is pretty straightforward, it still comes with risks, unfortunately. It would be lovely if a business had no risks, right?
Competition from AutoZone, Advance Auto Parts, and CarParts.com. It’s a fierce battlefield with price wars or better customer loyalty programs fueling it.
O’Reilly relies heavily on its smooth supply chain to maintain solid inventory levels. Another global event, like the pandemic, will impact the business.
The shift toward EVs and advanced automotive tech could reduce demand for traditional aftermarket parts.
O’Reilly depends on knowledgeable and skilled employees to provide the quality it does. Labor shortages, wage inflation, or difficulties retaining employees could impact its operations quite significantly.
Of course, rising costs for materials, transportation, and wages are a risk for the business in this market.
The growing trend of online shopping for automotive parts poses a risk to O'Reilly's brick-and-mortar business model. While O'Reilly is expanding its online presence, the competition from platforms like Amazon may intensify.
7. Financial Health
7.1 Assets Assessment
My aim here is to highlight areas of interest or worry, going over every little aspect here would need a separate article, it’s just too much. If I don’t mention a particular item, you can assume it’s an area that meets expectations or doesn’t pose any significant issues.
We’re seeing a steady increase in inventory. Some investors tend to worry about this, which should be monitored along with Inventory Turnover and Days Inventory Outstanding.
The inventory growth aligns with O’Reilly’s business expansion (e.g., new stores, higher sales, and broader product offerings). We see a gradual increase in turnover, which suggests that O’Reilly is efficiently managing inventory as sales grow. DIO (Days Inventory Outstanding) has decreased, which indicates inventory is moving faster, which is good for cash flow and reduces the risks of inventory obsolescence. Therefore, the inventory growth is good and not something we should be concerned about.
Inventory growth aligns with business expansion and market demand.
Improving inventory turnover and declining DIO indicate better inventory management efficiency over time.
The cash position looks like it is built on shaky ground, yes. As many of you know, I love a business that shows sustainable growth in its cash position; this is not the case here, clearly.
Why is it?
Aggressive share repurchase program
Capital-intensive business
Minimal reliance on cash reserves (more on FCF)
In the case of O’Reilly, this should not be of any worry for us. I had to mention it because I felt that some of you must wonder because I always boast about solid cash positions of business.
7.2 Liabilities Assessment
Let’s take a closer look at O’Reilly’s liabilities, shall we?
You might see this and think, ‘‘Oh no, O’Reilly is taking on more debt year-over-year?!’’. Yes, they are.
I dove into their earnings call to find out why O’Reilly is doing so.
O'Reilly is taking on more long-term debt to maintain financial flexibility, support their share buyback program, and manage their leverage ratio prudently. This strategy allows them to return capital to shareholders while keeping their financial metrics within targeted ranges.
O’Reilly can do so, their business and FCF allows them to.
Cashflow/Debt ratio: 0.38 (decent, > 1.0 is ideal)
Long-term Debt/Asset ratio: 0.5 (decent)
Net Debt/EBITDA: 2.04 (reasonable)
Debt/Equity: -5.36 (common for buyback-heavy companies)
O'Reilly's financial metrics indicate manageable debt levels, but there’s some risk associated with its negative equity and reliance on debt financing. The company's strong cash flow generation provides a buffer, but it should carefully monitor debt levels to avoid over-leverage.
Besides this, O’Reilly has an excellent liabilities sheet! 😁
8. Capital Structure
8.1 Expense Analysis
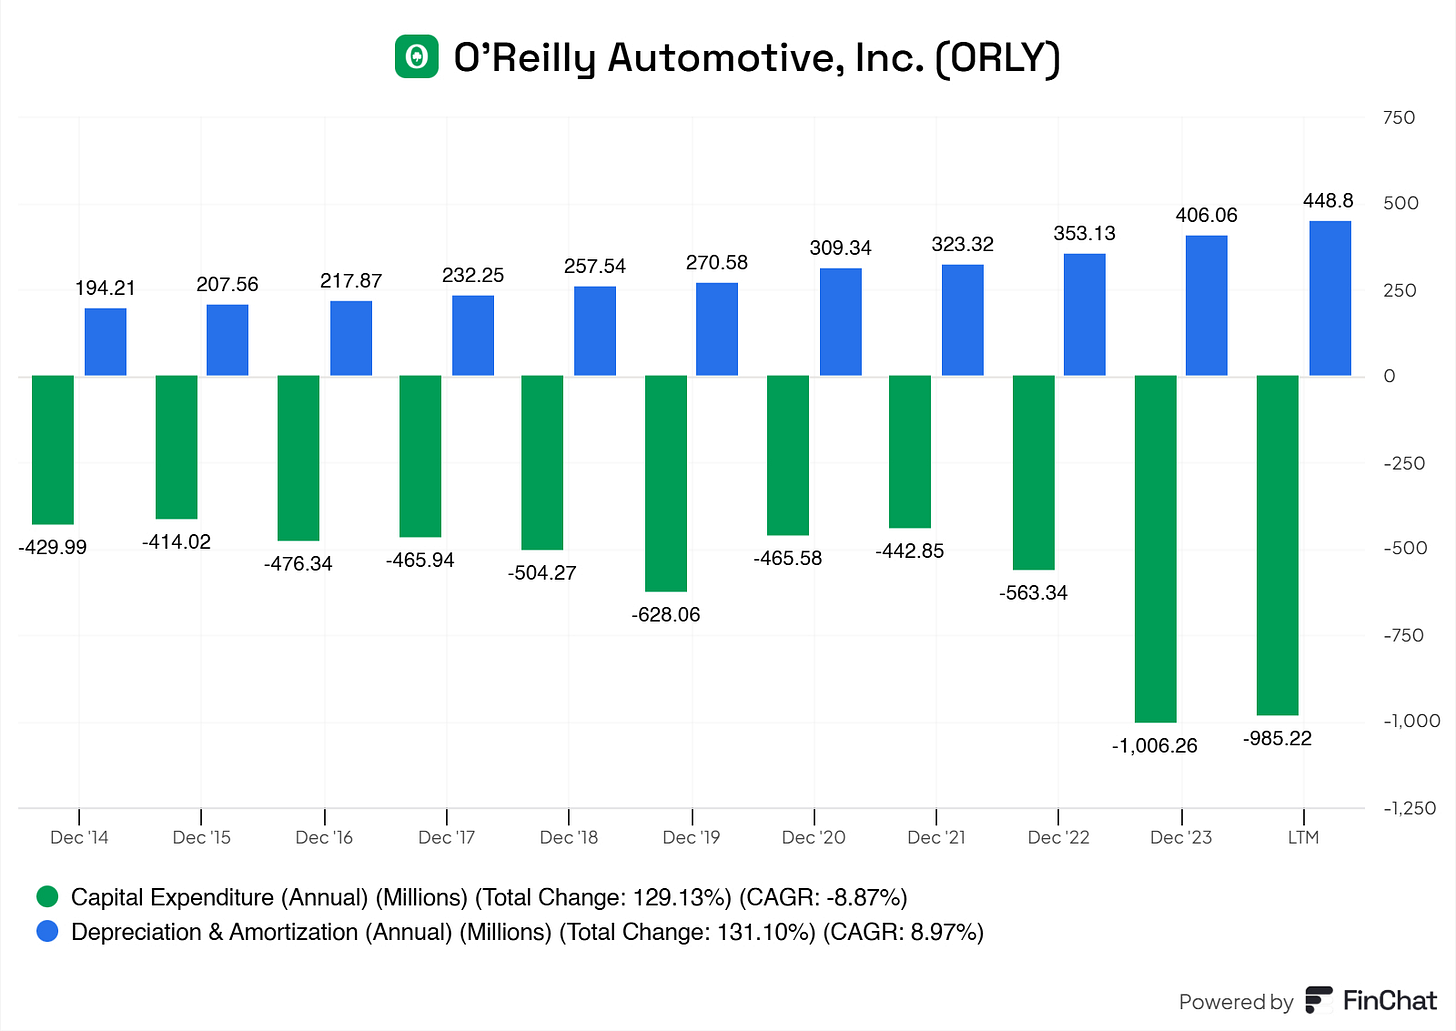
O’Reilly is expanding; therefore, in this CapEx, there is ‘‘Growth CapEx’’ baked in; let’s figure out what the growth CapEx is for O’Reilly.
Taking depreciation & Amortization and the CapEx, we can calculate the growth CapEx and maintenance CapEx for the business.
Growth CapEx= Total CapEx − Depreciation Expense
Dec '14: -235.78M
Dec '15: -206.46M
Dec '16: -258.47M
Dec '17: -233.69M
Dec '18: -246.73M
Dec '19: -357.48M
Dec '20: -156.24M
Dec '21: -119.53M
Dec '22: -210.21M
LTM: -536.42M
* Growth CapEx is focused on expanding operations.
The remainder of the CapEx (Total CapEx −Growth CapEx) is the maintenance CapEx. This refers to the portion of a company's capital expenditures (CapEx) spent on maintaining, repairing, or replacing existing assets to ensure the business continues operating at its current level.
Knowing the maintenance CapEx, let’s compare it to total revenue to see how much of a burden the CapEx is or not.
LTM, the Maintenance CapEx/Total Revenue is roughly 2.73%, which is extremely reasonable!
Growth CapEx/ Total Revenue is roughly 3.26%, which is also very reasonable.
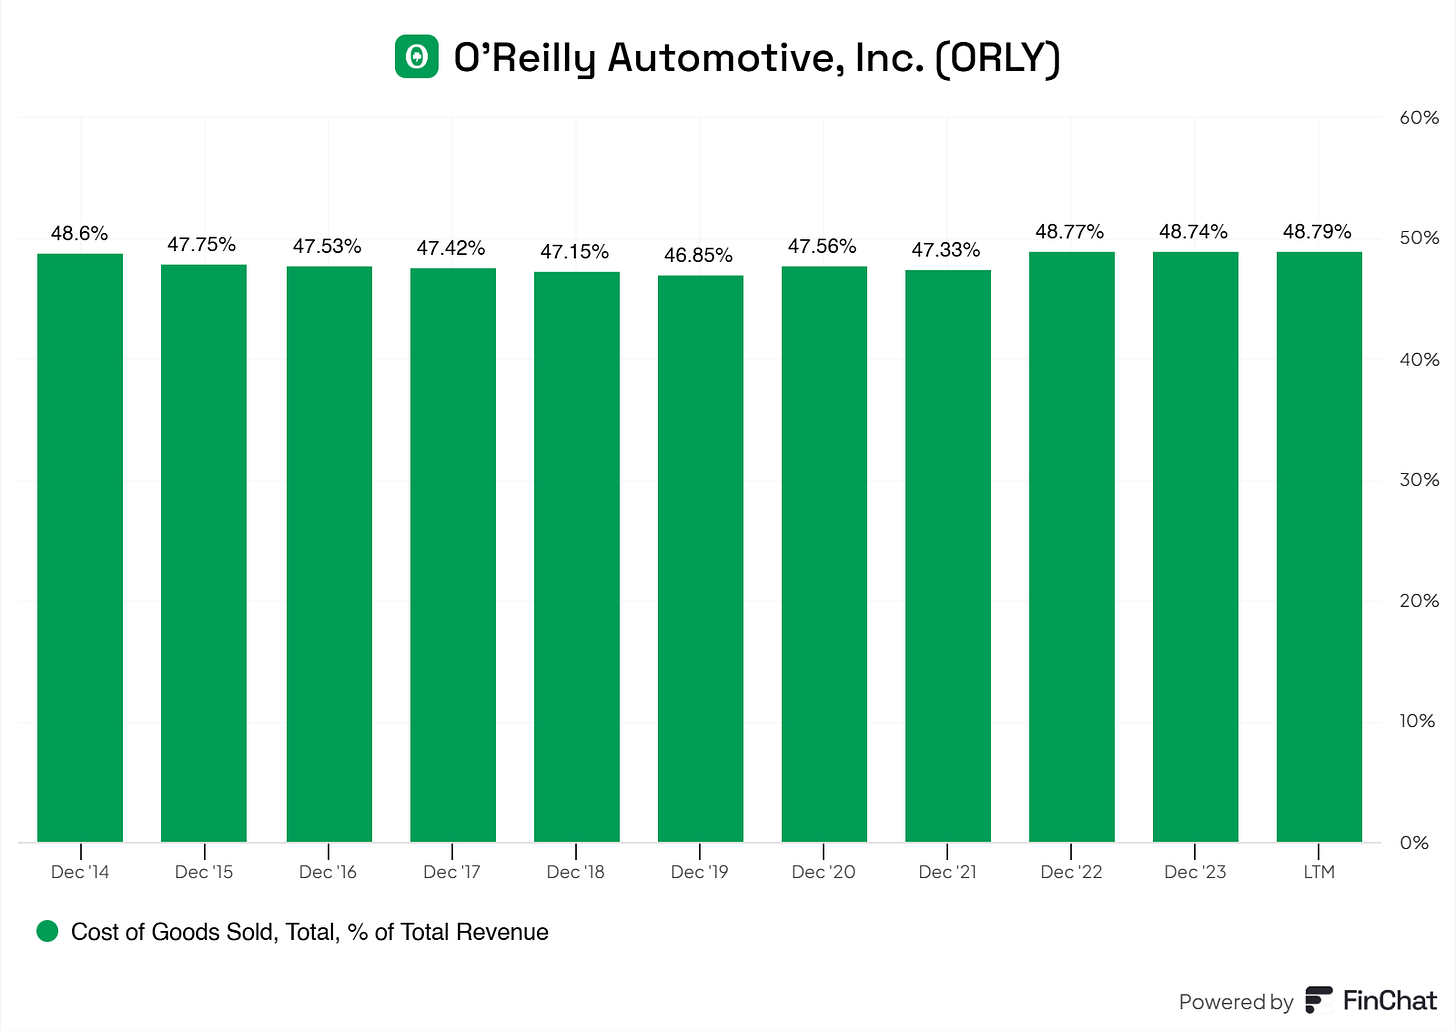
COGS (Cost of Goods Sold) has remained steady for O’Reilly for the last 10 years, which is lovely to see.
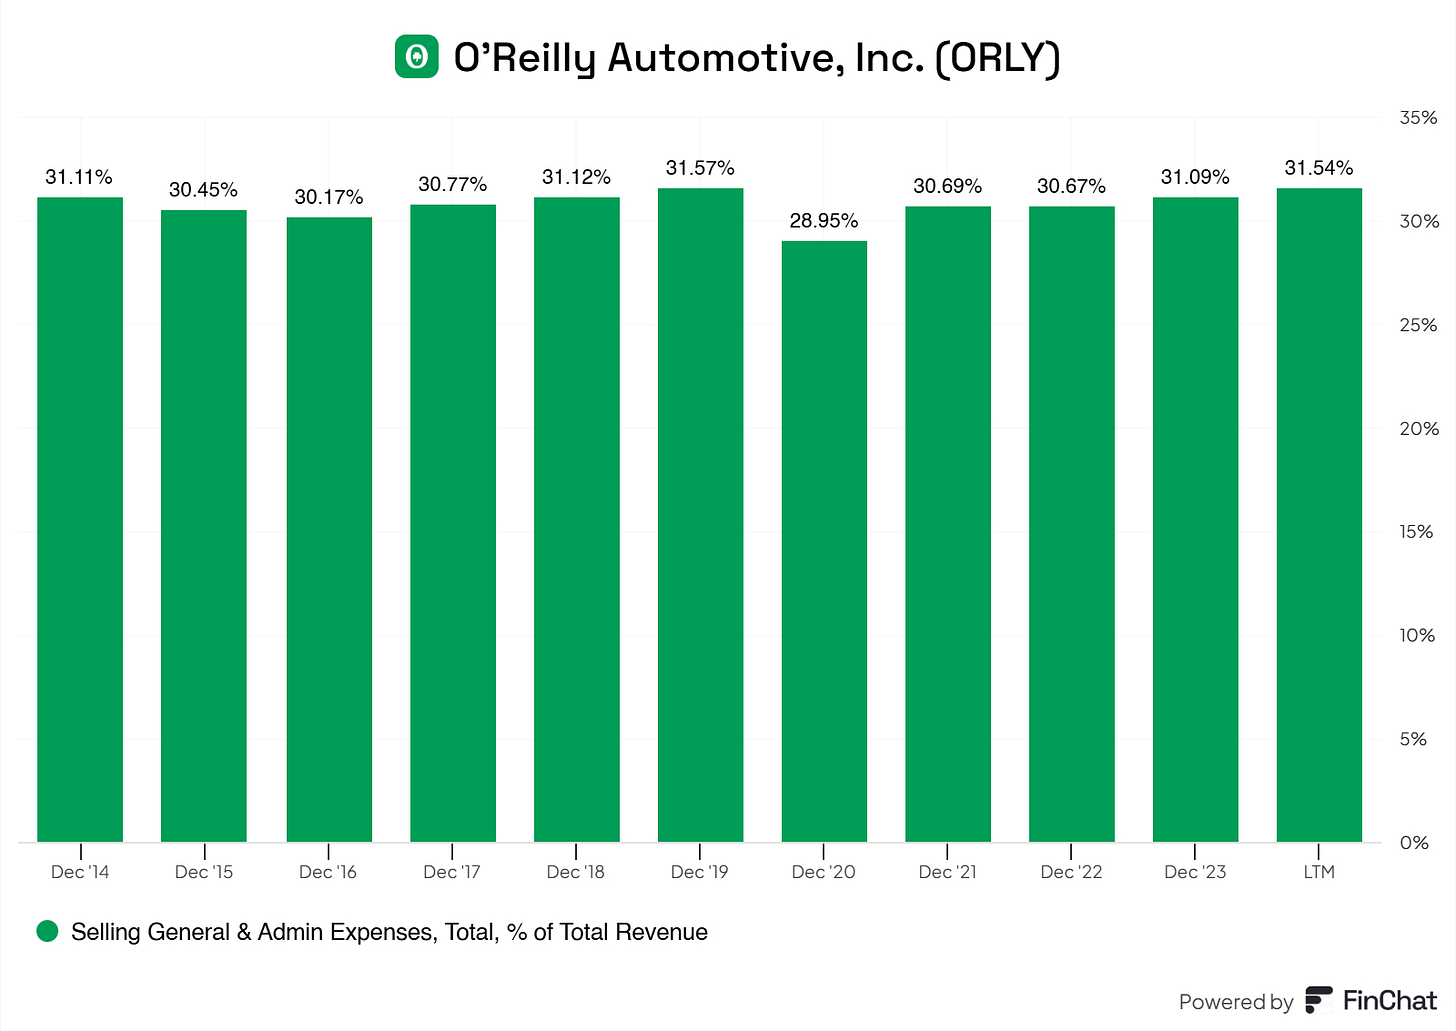
The same goes for SG&A (Selling General & Admin Expenses). These have also remained stable for O’Reilly.
Of course, in an ideal situation, we would love to see the COGS and SG&A slight decrease in comparison to its total revenue, but stabilization is also good enough for a business. Sometimes a decrease cannot be achieved, especially in O'Reilly's sector. In tech, you can do so very efficiently, but that’s the special duck in the pond.
8.2 Capital Efficiency Review
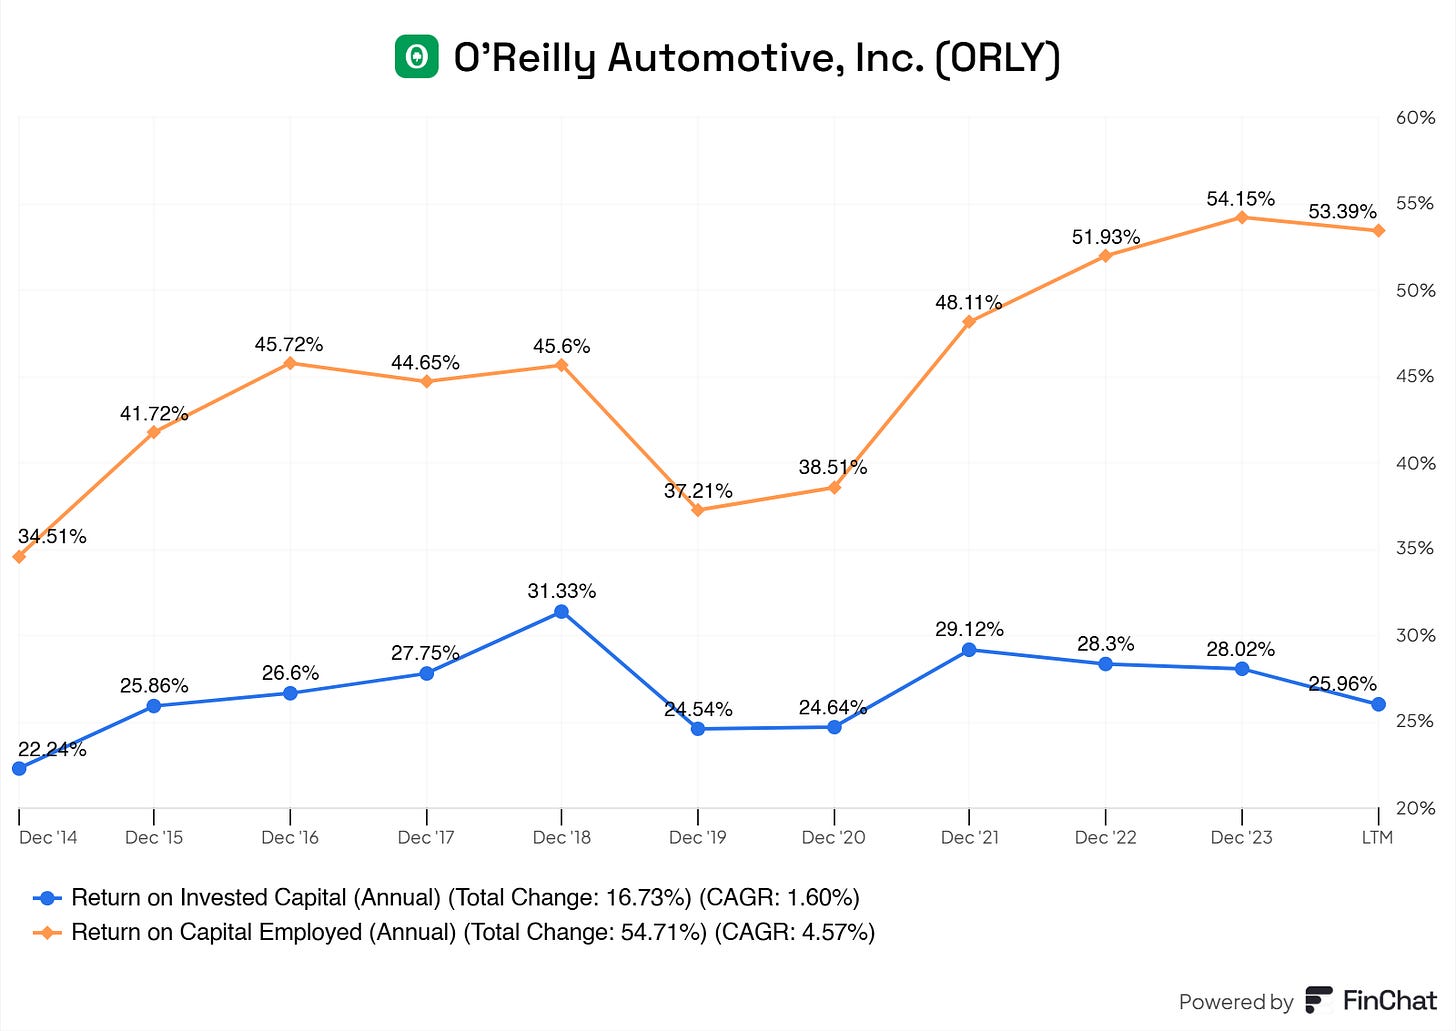
My favorite part is capital efficiency. Let’s check how O’Reilly manages their capital, shall we?
EX-CEL-LENT!
Sometimes we should avoid discussing a topic to ensure the beauty marinates, let’s do that here.
High and sustained ROIC and ROCE, excellent!
9. Profitability Assessment
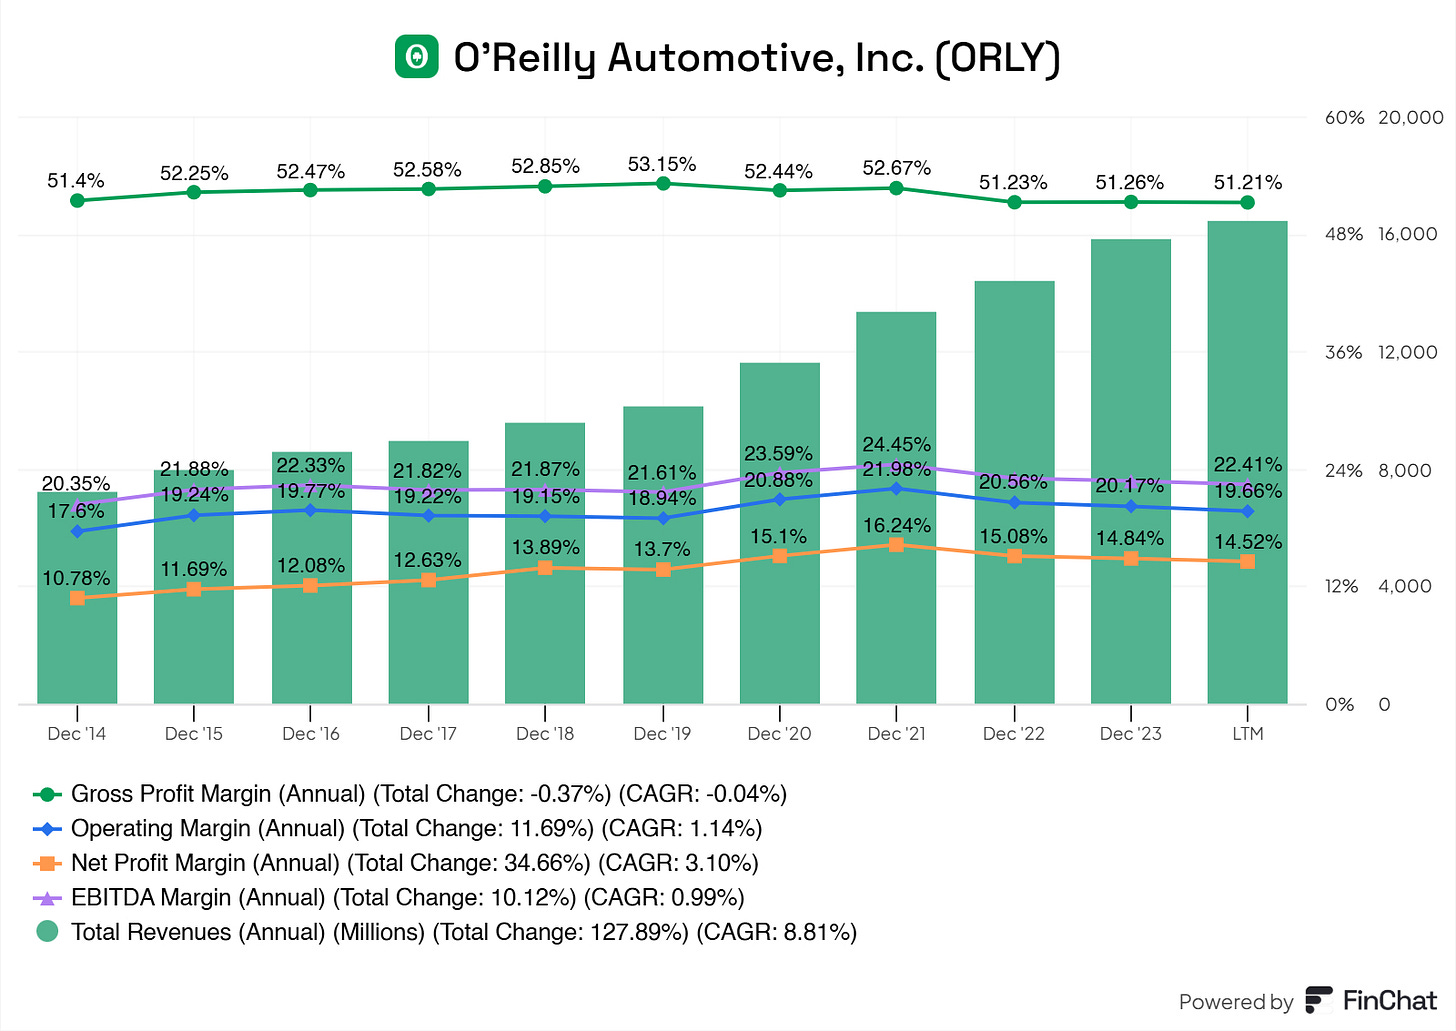
9.1 Profitability, Sustainability, and Margins
Again, EX-CEL-LENT!
Wonderful margins across the board for O’Reilly. Seeing that for a decade, O’Reilly is capable of sustaining these margins, I do not see any issue in upholding these margins for the following decade.
9.2 Cash Flow Analysis
The FCF of O’Reilly is modest, and so is the FCF margin.
O’Reilly does not do a lot of SBC, making these free cash flows more reliable and sustainable.
For our visual learners, here is the FCF/SBC.
We love to see companies who try to avoid using SBC too much. SBC, to me, is unnecessary dilution and should be treated accordingly.
10. Growth Projections
EPS Fwd 2Yr: 8.08% CAGR
Rev Fwd 2Yr: 5.44% CAGR
EBITDA Fwd 2Yr: 4.56% CAGR
Rev 5Yr: 10.5% CAGR
Regarding the FCF, O’Reilly is growing it with a CAGR of roughly 10%. I think this is sustainable for the next five years. Taking the 2023 FCF of the business and applying a 10% CAGR, here’s what the FCF might look like for O’Reilly.
2024: $2,230.60M
2025: $2,453.66M
2026: $2,699.03M
2027: $2,968.93M
2028: $3,265.82M
2029: $3,592.41M
Do these growth projections excite me? They do! For O'Reilly's size and market share, these are modest outlooks for the business and should yield modest returns if invested.
11. Value Proposition
11.1 Dividends Analysis
O’Reilly does not pay a dividend. That’s good. The business should focus on growing its operations nationally and internationally.
10.2 Share Repurchase Programs
O’Reilly is an absolute MONSTER when it comes to share buybacks.
I mean, look at this.. this is every investor’s wet dream.
Their timing seems about alright. O’Reilly hasn’t seen any ‘significant’ dips, allowing more strategic buybacks.
Overall, O’Reilly is an absolute monster in its buybacks.
11.3 Debt Reduction Strategy
We’ve discussed this previously: they’re strategically increasing debt.
12. Quality Rating
13. Valuation Assessment
Before we get into the valuation of O’Reilly Automotive, here is a quick announcement!
Would you like:
A spreadsheet with ALL the high-quality stocks on my radar?
A personalized investment case just for you?
Or a 30-minute Zoom call to discuss anything investment-related?
Refer a friend with the new referral program to get it.
Discounted Cash Flow: $873.55
I find that O’Reilly has a low-risk factor to it, and for that reason, I use a lower RRR, 8%. With higher risks, businesses always increase the RRR.
(RRR = Required Rate of Return)
Multiples Valuation: $867.98
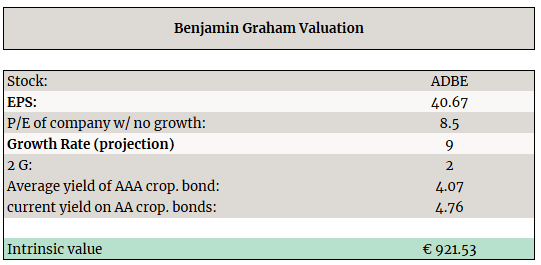
Benjamin Graham Valuation: $921.53
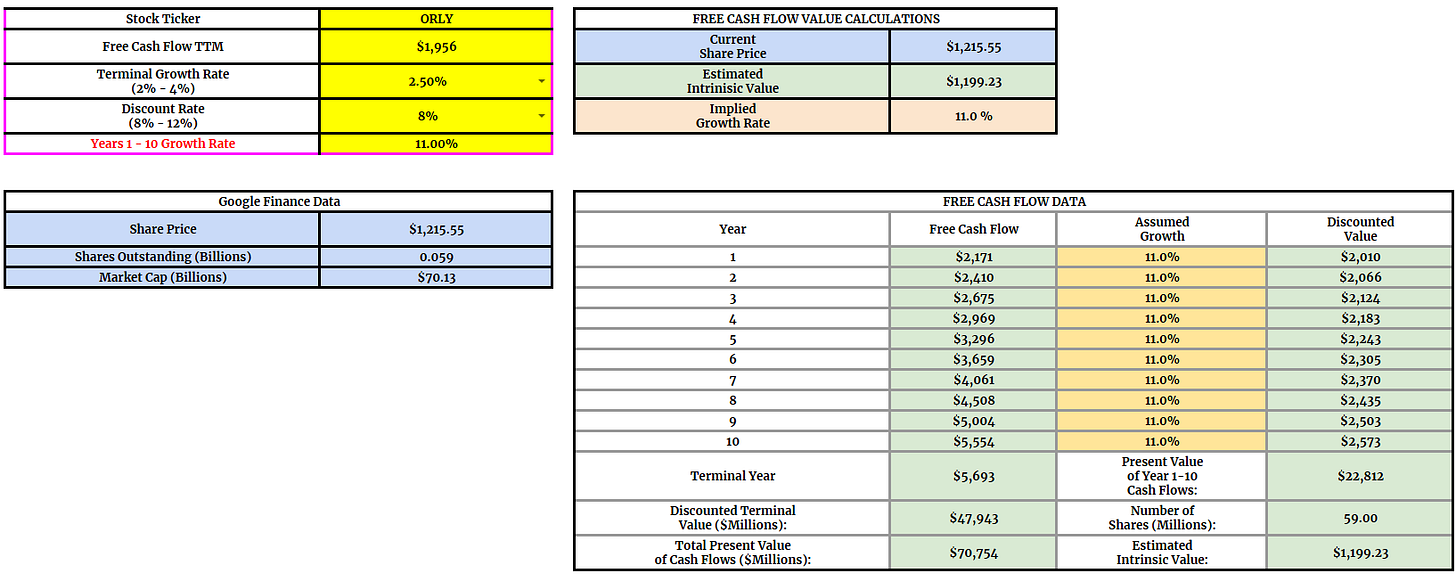
Reverse Discounted Cash Flow: O’Reilly should grow its FCF by roughly 11% annually for 10 years.
This is not cheap, but I wouldn't say O’Reilly can’t do it.
O’Reilly Automotive is an excellent, high-quality business, and I would love to dedicate a section of my portfolio to it someday.
If you’re curious about my personal investment portfolio? Click the button.
Used Sources
Finchat: Financial Data (get it with 15% off using my affiliate link)
Disclaimer
I do not own O’Reilly Automotive shares and do not intend to buy any within the next six months.
By reading my posts, subscribing, following me, and visiting my Substack, you agree to my disclaimer, which can be read here.











O’Reilly’s 20-year CAGR of 22.44% is impressive.