Ferrari: Where Luxury Cars Drive Luxury Shareholder Returns
Since 2016, Ferrari has delivered an impressive total return of 889.33%, translating to a remarkable CAGR of approximately 28.91%. At its peak, the total return soared to an astonishing 1,000% return.
Hi, partner! 👋🏻
As a youngster, I saw these red, flashy sportscars in the neighborhood with a beautiful horse logo. I remember vividly telling myself every time I saw one, ‘‘I will get one in the future!’’, of course not knowing the price tag of these sports cars. Still, I was impressed with the sports cars and the types of people driving these exclusive cars.
Years later, I started investing and came across the stock. I had to check out the hype to understand the vehicles and the company behind these vehicles. I’ve always admired the company and its products, and to this day, I’m impressed by its business model, the prestige surrounding the brand, and the quality of not only its vehicles but also the company itself.
Today, we’ll examine the company and peel back every layer so that, at the end of this investment case, we will know its details and how it can perform the way it does.
Thank you for being part of another investment case, and happy reading!
P.S. It would mean the world if you could restack this investment case! ❤️
If you’re interested in my previous investment cases, you can check them out here:
Table of contents
Corporate Analysis
1.1 Business Overview
1.2 Revenue BreakdownExecutive Leadership
2.1 CEO Experience
2.2 Employee Satisfaction Ratings
2.3 CEO Value CreationInsider and institutional ownership
Competitive and Sustainable Advantages (MOAT)
Industry Analysis
5.1 Industry Growth Prospects
5.2 Competitive LandscapeRisk Assessment
Financial Stability
7.1 Asset Evaluation
7.2 Liability AssessmentCapital Structure
8.1 Expense Analysis
8.2 Capital Efficiency ReviewProfitability Assessment
9.1 Profitability, Sustainability, and Margins
9.2 Cash Flow AnalysisGrowth Projections
Value Proposition
11.1 Dividend Analysis
11.2 Share Repurchase Programs
11.3 Debt Reduction StrategiesQuality Rating
Valuation Assessment
1. Corporate Analysis
1.1 Business Overview
As usual, we’ll ask ourselves, "Do we understand the business and how it generates its revenues?" If we can answer this questionshort, we have a solid grasp of the business.
Ferrari is an Italian luxury car manufacturer famous for its high-performance sports cars, often seen as symbols of speed, prestige, and exclusivity.
How does Ferrari generate its revenues?
Selling luxury cars (occasionally Ferrari creates ultra-exclusive, limited-edition models for collectors, which are even more expensive than their regular cars)
Formula 1 racing (Scuderia Ferrari: While Formula 1 itself isn’t a direct profit source, it boosts Ferrari's brand image and attracts sponsorship deals, which contribute to revenue.)
Merchandising and licensing (clothing, watches, and accessories. Licensing their brand for video games, toys, and other products, earning royalties)
After-sales services (The cars need to be maintained and serviced)
Financing and other services (Ferrari offers financing and leasing options to their customers, generating additional revenue)
Now, we have a basic grasp of Ferrar’s business model. Let us go over their revenues, shall we?
1.2 Revenue Breakdown
Ferrari’s reported revenue drivers are as follows:
Cars and Spare Parts Revenue (accounts for roughly 85% of the business)
Sponsorships, Commercial and Brand Revenue (accounts for roughly 10% of the business)
Total Other Revenue (accounts for roughly 5% of the business)
Here’s a snapshot of their revenues from Ferrari’s latest earnings release. Most of Ferrari’s revenue comes from the business's cars and spare parts segment.
Usually, I’m not a fan when a company relies on one segment, but I could make a special exception for Ferrari. Why, you might ask? Good question! I firmly believe that with Ferrari's brand power and timeless concept, there’s no reason to expect Ferrari either to become obsolete or for consumers to shift away from Ferrari. Ferrari sells cars, but it also sells prestige, and consumers worldwide will always want prestige, and they’ll pay every price to show off their prestige to the world.
The importance we confer on prestige makes sense from an evolutionary perspective. For our ancestors, being more popular was a survival advantage. Social status offered greater group protection and longevity, making them more likely to reproduce.
Similarly, as modern individuals, we seek out and follow paths that will maximize our social status and capital, even if we do not realize we are doing it. Professor Cameron Anderson explained that status influences how we behave and think. For example, wearing designer clothing or driving a sports car may be part of our desire for prestige.
Such status symbols can help maintain social hierarchies. Dr. Sabina Siebert from the University of Glasgow found that when faced with competition from other professions, barristers protected their prestige by using status symbols, including professional dress, ceremonies, and rituals. She concluded that this allowed “elite professionals to maintain their superior status.’’
Modern society has exacerbated our desire for high-ranking status, with social media as a giant leaderboard where we compete to gain the most prestige points.
With that said, let us look closer at the revenues and their weight over the past decade.
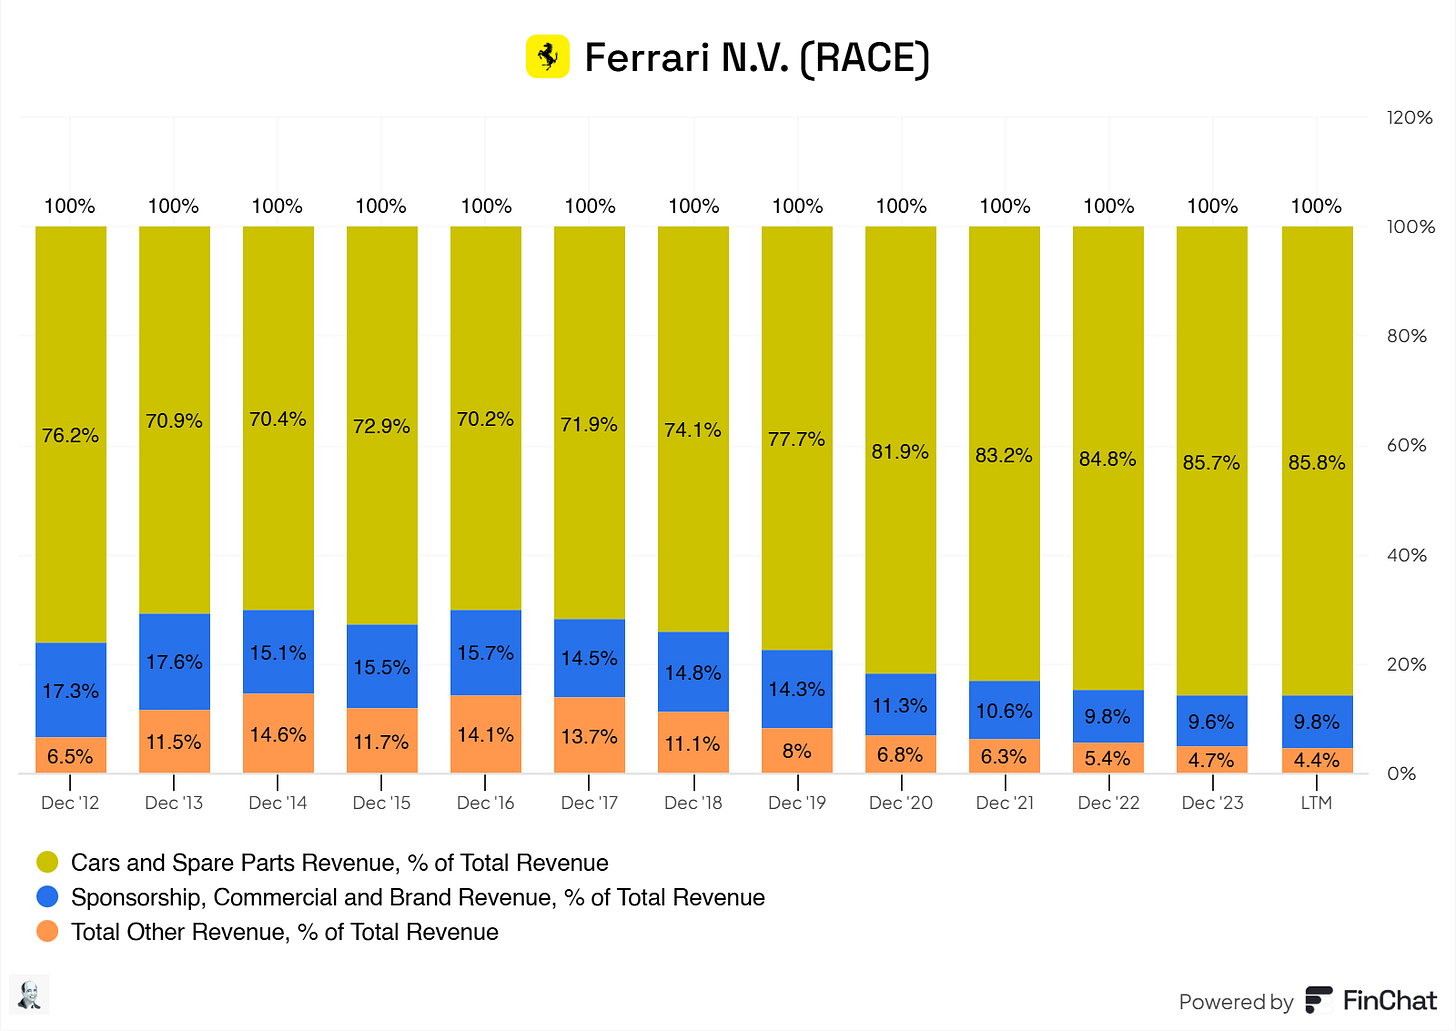
Overall, the revenues and their weight have been stable. The cars and spare parts segment has been taking up more since 2016. Should investors be worried about this (rather large) shift? No, they should not.
Ferrari has seen growing demand for its vehicles, especially with the introduction of new models and limited editions that boost sales. Moreover, Ferrari often increases the prices of its models. This boosts revenue per car sold and increases the weight of car sales in Ferrari’s total revenue.
In addition, sponsorships, commercials, and brand revenue are not Ferrari's core business. Ferrari is nitty-gritty about what deals it takes on, which results in lesser growth for that segment, which is good. Ferrari should not randomly take on sponsorships or deals. Their brand is on the line.
Ferrari consistently focused on its core expertise, as it should. Their expertise is building world-class luxury sports cars, and their primary focus should be on this segment.
This expertise is reflected in Ferrari releasing new mo’s take a closer look at the models that Ferrari has released.
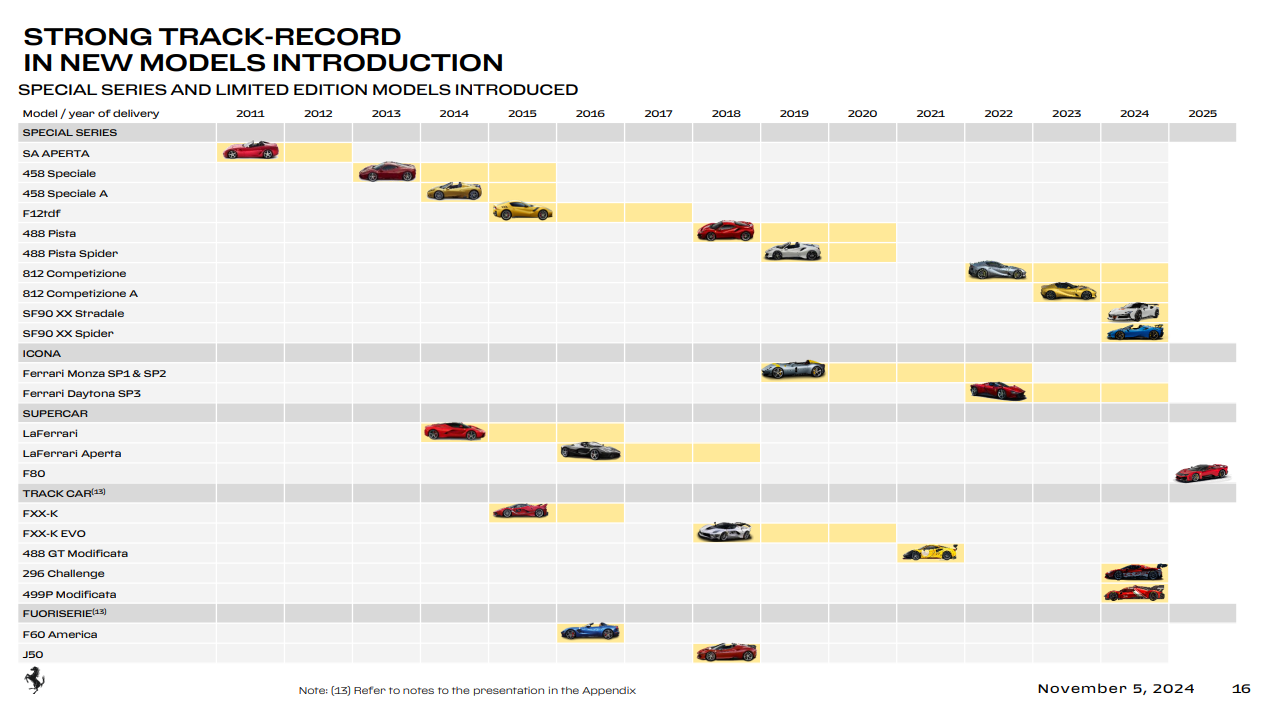
Ferrari introduces 1.93 cars per year, let’s say 2 for simplicity. This is excellent! Why? To ensure that Ferrari's cars stay exclusive and ‘rare,’ Ferrari can maintain their status. And do not be fooled; you can not ‘just buy the car,’ there’s a rather lengthy procedure before you can get your hands on a Ferrari compared to other brands. And the Ferrari’s are not made in large amounts; they are rather limited compared to other car manufacturers, keeping that exclusivity high.
In addition to its range models, there are also special series and limited model introductions. Here’s an overview of those.
These cars are manufactured at even lower rates, making these models even more exclusive (and, of course, more expensive).
Note: The following may differ depending on where you live and where you purchase a Ferrari.
Buying a Ferrari is, like I said earlier, a long process; here’s how it looks.
The first step is to go to the Ferrari dealer and make a deposit for the Ferrari. The second step is speaking the card with your desired options. After this process, Ferrari will let you know if your request can be accepted. After the waiting game, there’s more to it. If you’re lucky, you will not be placed on the waiting list with your purchase, but there’s a high probability you will be placed on the waiting list.
Buyers get updates (like photos) at the Maranello Factory in Italy during the build of their car. Once the car is completed, it is shipped to the dealership. Buyers are then invited to the dealership for an exclusive delivery experience (buyers can pick a delivery spot or their house).
In addition, you must sign papers stating that you will not apply aftermarket parts to the car or sell it to others unless you contact the dealership.
Note: first-time buyers may have limited access to certain models. Exclusive models or limited edition models tend to be reserved for loyal customers with a track record of buying Ferrari’s
This is a bird’s view of the process of owning a Ferrari. Through this process, you can grasp the exclusivity of buying a Ferrari.
If you’re interested in more stories on the process of buying a Ferrari, check out this Reddit post in the Ferrari community.
Now, let us go over Ferrari’s management.
2. Executive Leadership
2.1 CEO Experience
With these luxury brands in their management, I always find intriguing items; let us review them.
The current CEO is Benedetto Vigna. Benedetto Vigna has been the Chief Executive Officer since September 2021.
Before joining Ferrari, he was President of STMicroelectronics’ Analog, MEMS, and Sensors Group since January 2016 and also a member of ST’s Executive Committee from May 31, 2018. Vigna joined ST in 1995 and founded the Company’s MEMS activities (Micro-Electro-Mechanical Systems). Under his guidance, ST’s MEMS sensors established the Company’s leadership with large OEMs in motion-activated user interfaces. His responsibilities were expanded to include connectivity, imaging, and power solutions, and he piloted a series of successful moves into new business areas, focusing on the industrial and automotive market segments. During his career, Vigna has filed over 200 patents on micromachining, authored numerous publications, and sat on the boards of several EU-funded programs, including start-ups and worldwide recognized boards of Asian and American research centers. Benedetto Vigna graduated in Subnuclear Physics from the University of Pisa.
Benedetto Vigna holds no significant share, roughly 11.26K shares worth roughly 4.42M.
Is this worrisome for us investors? No, we’ll go over this in institutional and insider ownership. You’ll love that part because something beautiful will come to light.
2.2 Employee Satisfaction Ratings
Now, let us check how Ferrari scores with its employees. This type of information is widely available on sites like Glassdoor and Comparably.
The overall sentiment on Glassdoor is excellent. I truly feel that Ferrari ensures a good, sustainable, and healthy workplace for all its employees. I’m a fan of companies that take their employees with them along the ride to greatness. This results in a low turnover rate, giving employees longer tenure at the business. This, in return, creates employees who align with the company’s values and benefit for future business returns.
Some highlights on Ferrari and the actions they’ve taken to ensure the well-being of their employees are:
‘‘Working at Ferrari means being part of a unique and passionate team where our people are our greatest asset. Our commitment to the working environment is based on the latest technology to ensure the well-being of our people. All our employees and their families enjoy - among other services - medical care, bank services, fitness facilities, free school books, and a Summer Camp for their children.’’
‘‘All our employees and their families have the opportunity to benefit from dedicated services. Moreover, in 2022, we delivered to employees over 79,000 hours of training throughout the entire company to expand their skill sets and strengthen their expertise.’’
‘‘Ferrari is committed to an inclusive work environment, free from discrimination based on age, ethnicity, gender, religion, sexual or political orientation: pluralism and diversity ensure progress, new ideas, and innovation, creating enduring value. In our commitment to guarantee the primacy of merit, the Prancing Horse has Equal-Salary certification on a global level, validating equal pay and equal opportunities between genders.’’
These statements can be found on Ferarri’s LinkedIn profile.
Overall, I’m impressed by the culture created within Ferrari's workforce. Ferrari goes out of its way to create a sustainable and caring environment for its employees.
2.3 CEO Value Creation
Does the current CEO create value for the business? Yes, the CEO has been on board only since 2021, but there’s at least some data already.
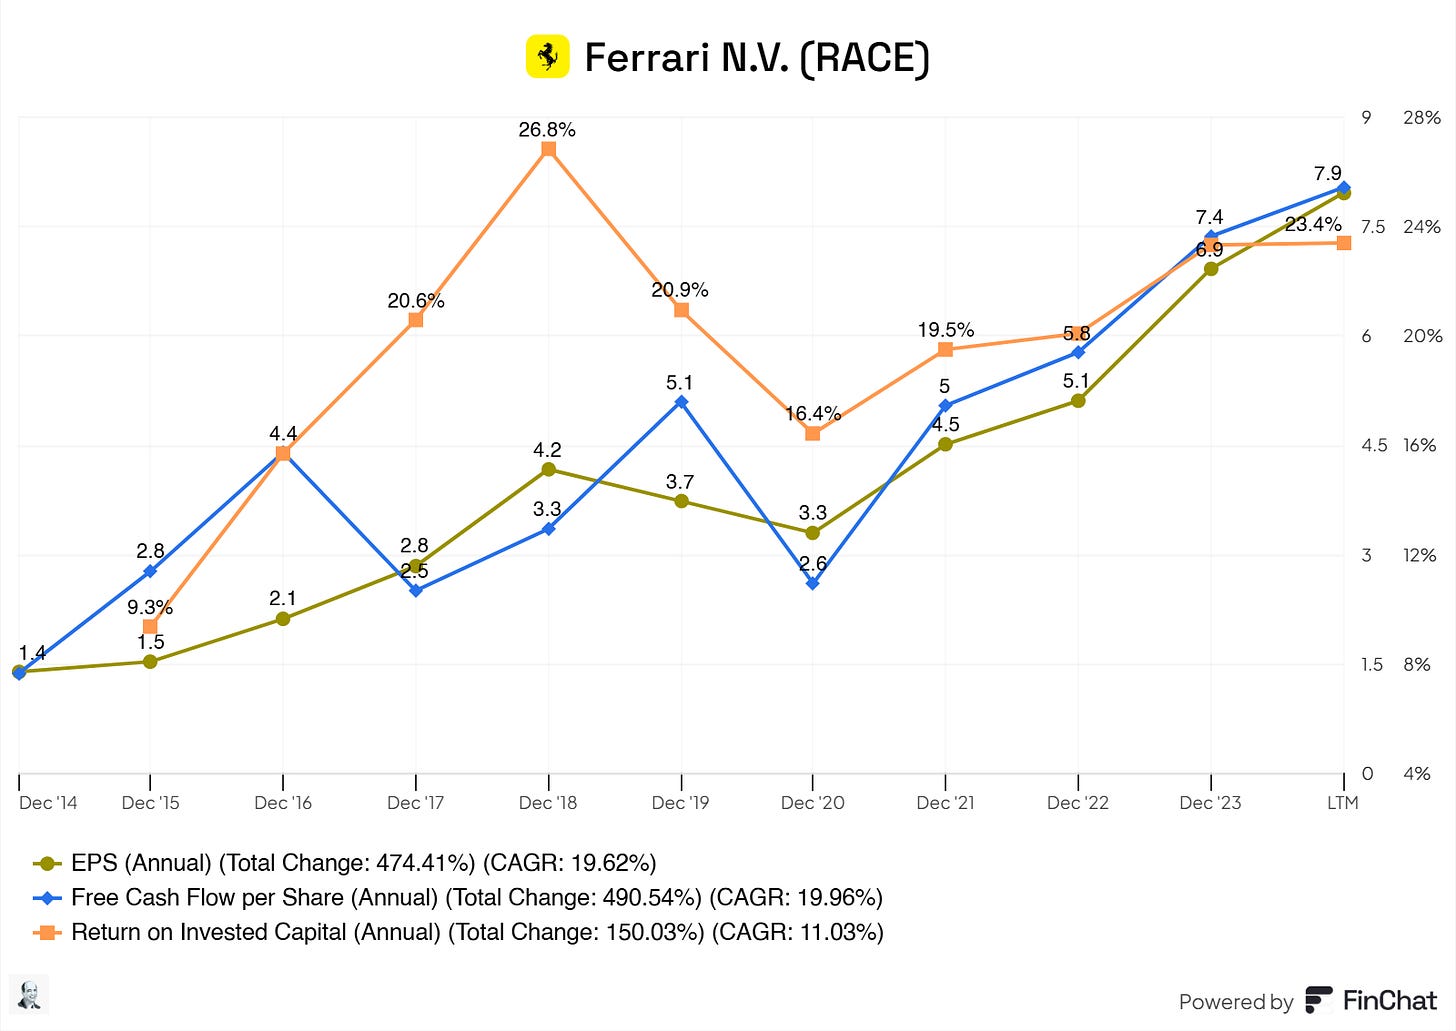
Undoubtedly, the current CEO creates value for shareholders and the business. Returns on Invested Capital have been excellent, surpassing the 20% mark in 2017. In addition, earnings per share and free cash flow per share have consistently grown year over year.
3. Insider and institutional ownership
Here comes my favorite part about Ferrari; you’ll figure out why by the end of this segment.
Insiders do own a significant portion of the shares, 10.6%. These shares, 10.55%, are held by Piero Ferrari
Institutional ownership is also rather low compared to other businesses listed on the stock exchange, and there’s a good reason for it.
Giovanni Agnelli B.V. (roughly 24.81% with a market value of roughly $17.44B)
Giovanni Agnelli B.V. is a Dutch holding company associated with the Agnelli family, one of Italy's most influential and wealthiest families. The family is well-known for its involvement in the automotive, finance, and media industries, most prominently through its ownership of Fiat (now part of Stellantis), Ferrari, Juventus F.C., and other significant businesses.
4. Competitive and Sustainable Advantage (MOAT)
So, a MOAT can be in either one or more of the following forms:
Brand Power
Patents
Scale and Cost Advantages
Switching Costs
Network Effect
Attracting Talent (I consider this a MOAT, others don’t. Decide for yourself)
Brand Power
Undoubtedly, Ferrari has significant brand power. I would even argue that Ferrari holds one of the strongest brand power moats in the luxury automotive industry. Their moat stems from its unprecedented advantages, reputation, exclusivity, and global recognition. Ferrari is synonymous with luxury, performance, and exclusivity.
Patents
Ferrari’s moat does not have a moat in patens. Although some patents are linked to Ferrari for their engines, technology, or safety, there's no moat here for Ferrari.
Scale and Cost Advantages
Also, Ferrari has no real moat here. Unlike mass-market automakers, its strategy revolves around exclusivity, high margins, and low production volume, which inherently limits the potential for traditional economies of scale.
Switching Costs
In Ferrari's market segment, switching costs are relatively low in the traditional sense (e.g., financial or logistical hurdles). However, psychological and emotional factors can create a sense of loyalty and resistance to change for Ferrari customers.
Network Effect
Ferrari's business does not inherently benefit from traditional network effects (e.g., where a product becomes more valuable as more people use it). However, there are some indirect network-like benefits. Ferrari’s exclusive owner clubs, racing events, and gatherings foster a sense of community among its customers, creating a pseudo-network effect. Membership in these exclusive circles increases the brand's allure. Ferrari's dominance and history in Formula 1 create a global fan base and a "network" of enthusiasts who amplify its prestige. This drives brand recognition and demand for its vehicles, even among non-owners.
But no, this is not a real moat here.
Attracting Talent
Ferrari has a significant advantage in attracting top-tier engineering, design, and management talent. This stems from its reputation as one of the world's most iconic automotive and motorsport brands. Working for Ferrari is a career highlight for many professionals in these industries. The brand’s association with excellence, innovation, and luxury attracts elite talent. Ferrari’s history in Formula 1 further enhances its appeal to engineers and designers who aspire to work at the cutting edge of automotive performance.
5. Industry Analysis
5.1 Industry Growth Prospects
Grand View Research's research gives a clearer picture of what to expect from the luxury automotive industry.
Market Size & Growth
The global luxury car market, valued at $617.36 billion in 2022, is projected to grow at a CAGR of 6.9% from 2023 to 2030.
Growth is driven by rising numbers of ultra-high-net-worth individuals, increasing disposable income, and the growing adoption of electric vehicles (EVs).
Impact of COVID-19
The pandemic negatively affected the market, causing a 4% global economic contraction and a 15% decline in the automotive sector in 2020.
Europe and China were significantly impacted, with Europe's private vehicle registrations dropping 38.1% in the first half 2020.
Shift Toward EVs
Tightening emission standards and government incentives for sustainable transportation are boosting EV adoption.
EV sales in Europe grew by over 65% year-on-year in 2021, reaching 2.3 million vehicles.
Evolving Consumer Preferences
Buyers demand personalized, seamless, and exclusive sales and service experiences.
Luxury OEMs are investing in smart mobility features like voice assistance, autonomous driving, and gesture recognition.
Segment Insights
Sport Utility Vehicles (SUVs): Dominated the market with 57.6% revenue share in 2022, projected to grow at a CAGR of 7.3% due to customer preferences for convenience, safety, and styling.
Hatchbacks: Expected to grow at 6.8% CAGR, supported by new launches and increased disposable income.
Propulsion: ICE vehicles led with a 70.2% revenue share in 2022, but EVs are growing the fastest at a CAGR of 7.8%.
Regional Insights
Europe
Dominated the market with a 39.3% share in 2022 and is projected to grow at a CAGR of 6.1%.
Established automotive manufacturing and favorable government policies drive growth.
Asia-Pacific:
Expected to grow at the fastest CAGR of 8.2% due to increasing prosperity, government incentives for EVs, and shifting consumer habits.
5.2 Competitive Landscape
I identify the following as Ferrari’s peers/competitors.

BMW
Mercedes-Benz Group
Aston Martin
Volkswagen
Porche
Why these companies? Because there tend to be cars in the higher class segment, which aligns more with Ferrari. Volkswagen has Lamborghini, for instance.
Operating Margin: 27.61%
Ferrari (RACE) far outpaces its peers with a superior operating margin of 27.61%, reflecting exceptional cost control and efficiency. This is significantly higher than that of competitors like BMW (9.31%) and Mercedes-Benz (MBG, 8.82%).
Gross Profit Margin: 49.8%
Ferrari leads with a gross profit margin of 49.8%, underscoring its strong pricing power and brand premium. This is far ahead of rivals like Volkswagen (VOW3, 17.28%) and BMW (15.82%).
Return on Invested Capital (ROIC): 22.75%
Ferrari showcases remarkable efficiency in deploying capital with an ROIC of 22.75%, dwarfing peers such as BMW (5.08%) and Mercedes-Benz (4.71%).
Return on Capital Employed (ROCE): 26.84%
Ferrari dominates this metric with an ROCE of 26.84%, reflecting exceptional operational profitability. It far exceeds competitors like Volkswagen (5.97%) and Mercedes-Benz (8.31%).
Free Cash Flow (FCF) Margin (10-Year Avg): 19.39%
Ferrari shines with an FCF margin of 19.39%, showcasing its robust cash-generating ability. This margin is well above BMW (1.07%) and Volkswagen (1.48%).
Revenue Growth (10-Year CAGR): 9.84%
Ferrari leads in revenue growth with a 10-year CAGR of 9.84%, driven by its high-margin luxury positioning, outperforming competitors like BMW (6.69%) and Volkswagen (5.01%).
Diluted EPS Growth (10-Year CAGR): 18.4%
Ferrari delivers exceptional earnings growth at 18.4% CAGR, surpassing peers like Mercedes-Benz (4.23%) and BMW (8.14%).
Net Income Growth (10-Year CAGR): 17.92%
Ferrari achieves strong long-term profitability growth, with a net income CAGR of 17.92%, outpacing rivals like Volkswagen (1.62%) and Mercedes-Benz (3.75%).
EBITDA Growth (10-Year CAGR): 14.05%
Ferrari also excels in EBITDA growth at 14.05%, reflecting consistent operational strength. It is significantly ahead of Volkswagen (2.07%) and Mercedes-Benz (2.54%).
Ferrari is showing its dominance across nearly as many key financial metrics.
6. Risk Assessment
What are some risks we need to keep an eye out for?
Brand impairment: Ferrari is a well-known brand that gives it much power in its industry. If an event negatively impacts Ferrari, the results could be detrimental.
Economic cyclicality: Ferrari’s target, the ultra-high-net-worth individuals, is somewhat insulated from recessions but not immune. Global economic downturns or financial crises can reduce discretionary spending on luxury items.
Dependence on a niche market: Ferrari's limited production volume and niche focus make it vulnerable to shifts in consumer preferences or a decline in demand for ultra-luxury cars. (although unlikely, consumers can not be predicted, and a shift could occur)
Intellectual property and counterfeit risks: Ferrari’s iconic brand is a target for counterfeiting and misuse, which could dilute its brand equity and impact sales.
Key models: Ferrari relies on the success of key models (e.g., the Purosangue, SF90 Stradale). Any issues with new model launches or recalls could significantly affect revenue.
I’ll leave it up to you to decide how much every risk weighs on the business.
7. Financial Health
7.1 Assets Assessment
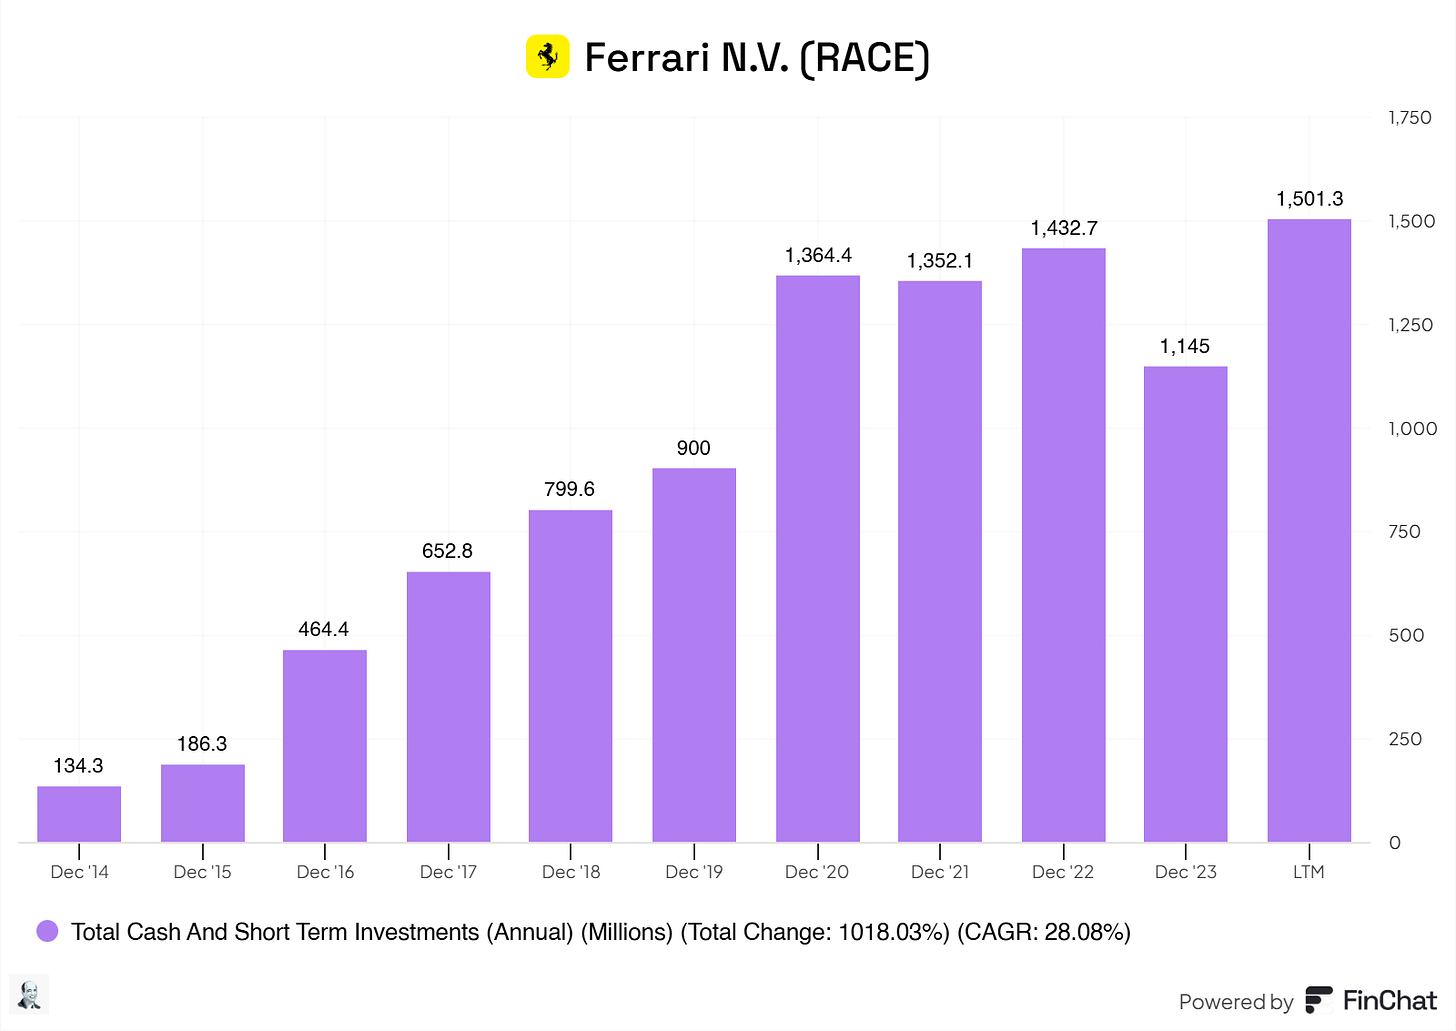
Ferrari has a solid cash and short-term investment part on its asset sheet. Some investors argue that a lower cash reserve is better. So, instead of keeping cash, use it deployed on projects to boost further growth. To some extent, I agree with that argument, but I like a solid cash position. In cases of emergencies, cash is needed to avoid liquidating other assets.
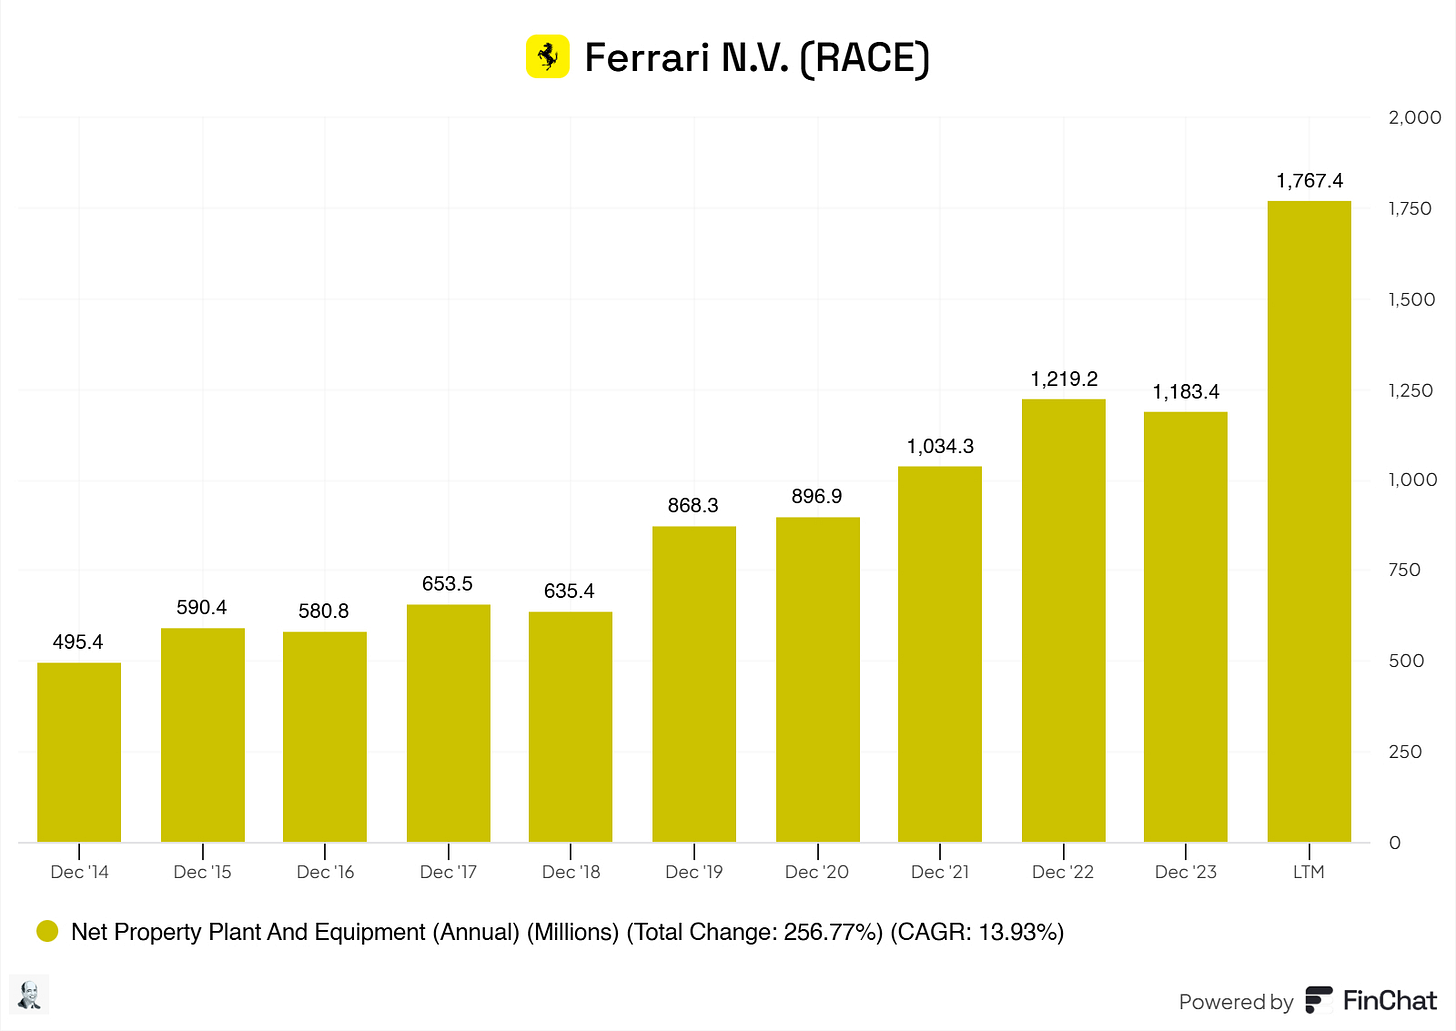
The increase in PPE aligns with the growth trajectory set out by Ferrari. So, yes, there’s a significant spike, but this shouldn’t worry any investor.
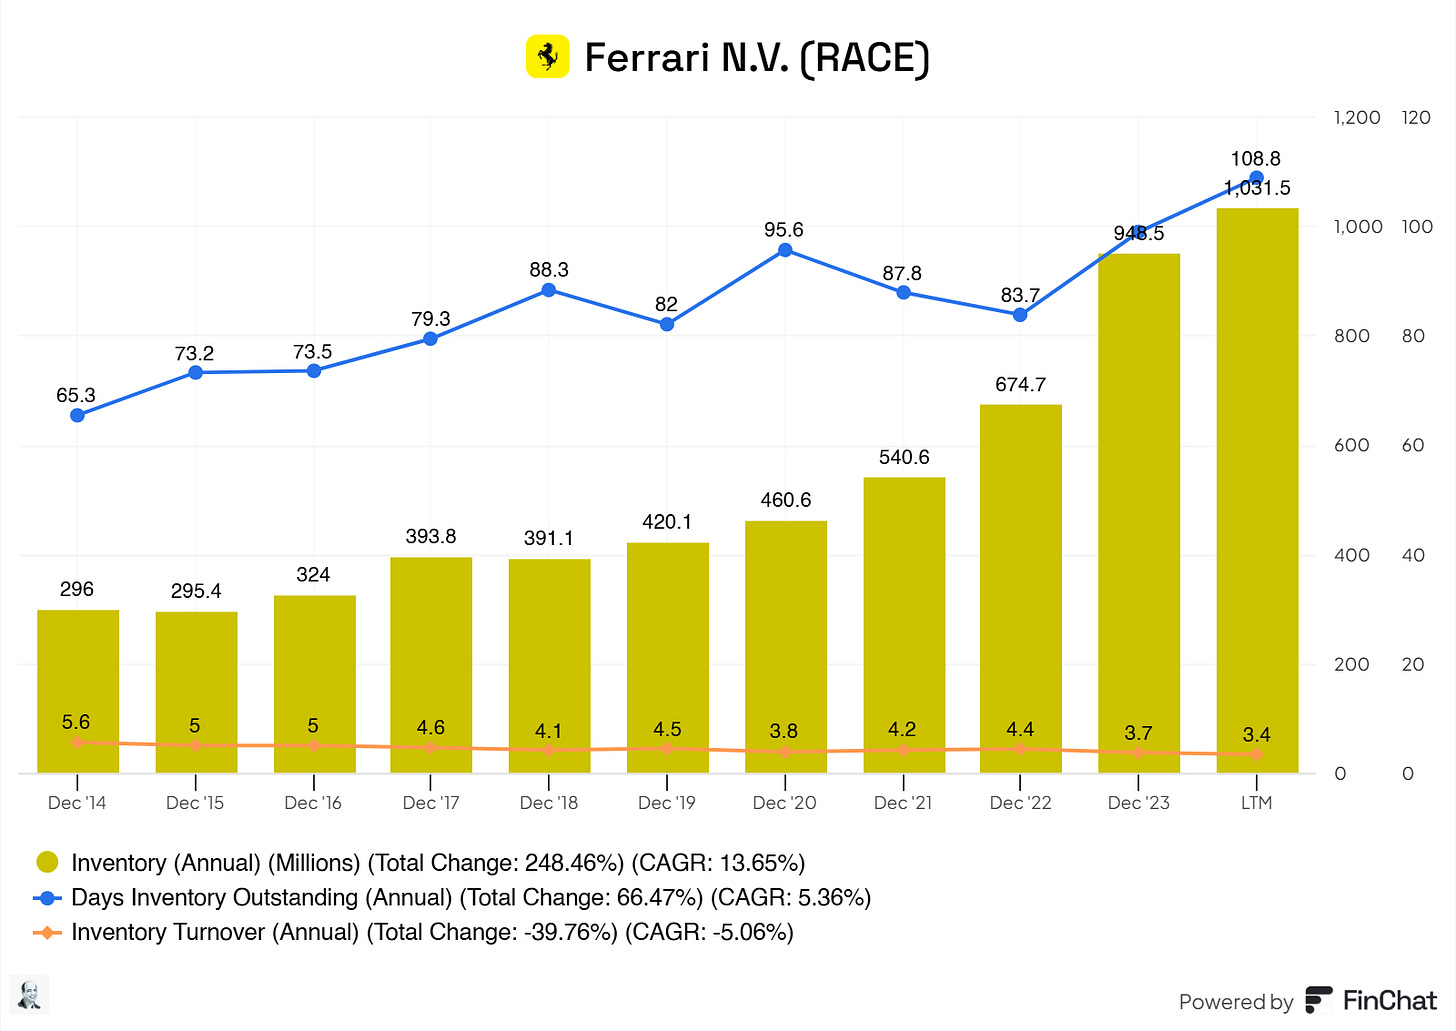
For the one with a keen eye, yes, inventory is growing. DIO is increasing, and inventory turnover is declining. Usually, this is an indication of slower-than-expected sales, taking longer to sell its inventory, and Slower customer orders or deliveries.
But is this the case with Ferrari?
No, this is a deliberate event.
Higher inventory levels or DIO do not necessarily equate to weaker demand for a brand like Ferrari. Instead, it might reflect strategic alignment with their production process or preparation for new launches.
The decline in inventory turnover aligns with Ferrari’s focus on quality and exclusivity, not inefficiency.
Ferrari's management discussed the order backlog in the latest earnings call for Q3 2024, highlighting that the order book has evolved as expected. The introduction of the new 12Cilindri coupe Spider has significantly contributed to the order intake, providing Ferrari with remarkable rolling visibility well into 2026. Ferrari has "exceptional order book visibility well into 2026," indicating a strong and healthy backlog extending several years into the future
Benedetto Vigna, Ferrari's CEO, mentioned that deliveries of the F80 supercar will start in Q4 2025 and continue for 2 to 3 years, totaling 799 units.
Benedetto Vigna stated:
"The third quarter again shows growing results for Ferrari, driven by a strong product mix and increased personalizations. It confirms our commitment to deliver on the promises we made at our Capital Markets Day in 2022, along with the exceptional order book visibility well into 2026, continuous product innovation – as evidenced by the F80 supercar just unveiled – and process innovation, with the strengthening of our in-house electrification expertise."
So, no. There’s no decrease in demand or issues with their order backlog.
7.2 Liabilities Assessment
Overall, Ferrari’s liability sheet appears manageable and aligned with its growth strategy. I do not see any areas that need monitoring.
Short and simple! How we love it when it comes to the liabilities sheet.
8. Capital Structure
8.1 Expense Analysis
Let us look closer at the expenses like COGS, SG&A, R&D, and CapEx!
We know that Ferrari is on a growth trajectory. Therefore, let us see what the CapEx is all about.
Growth CapEx = Total CapEx − Depreciation Expenses
The remainder of the CapEx, growth CapEx minus total CapEx, is also called maintenance CapEx. Remember, this is not precise, but it gives us a rough estimate.
Let’s do some calculations!
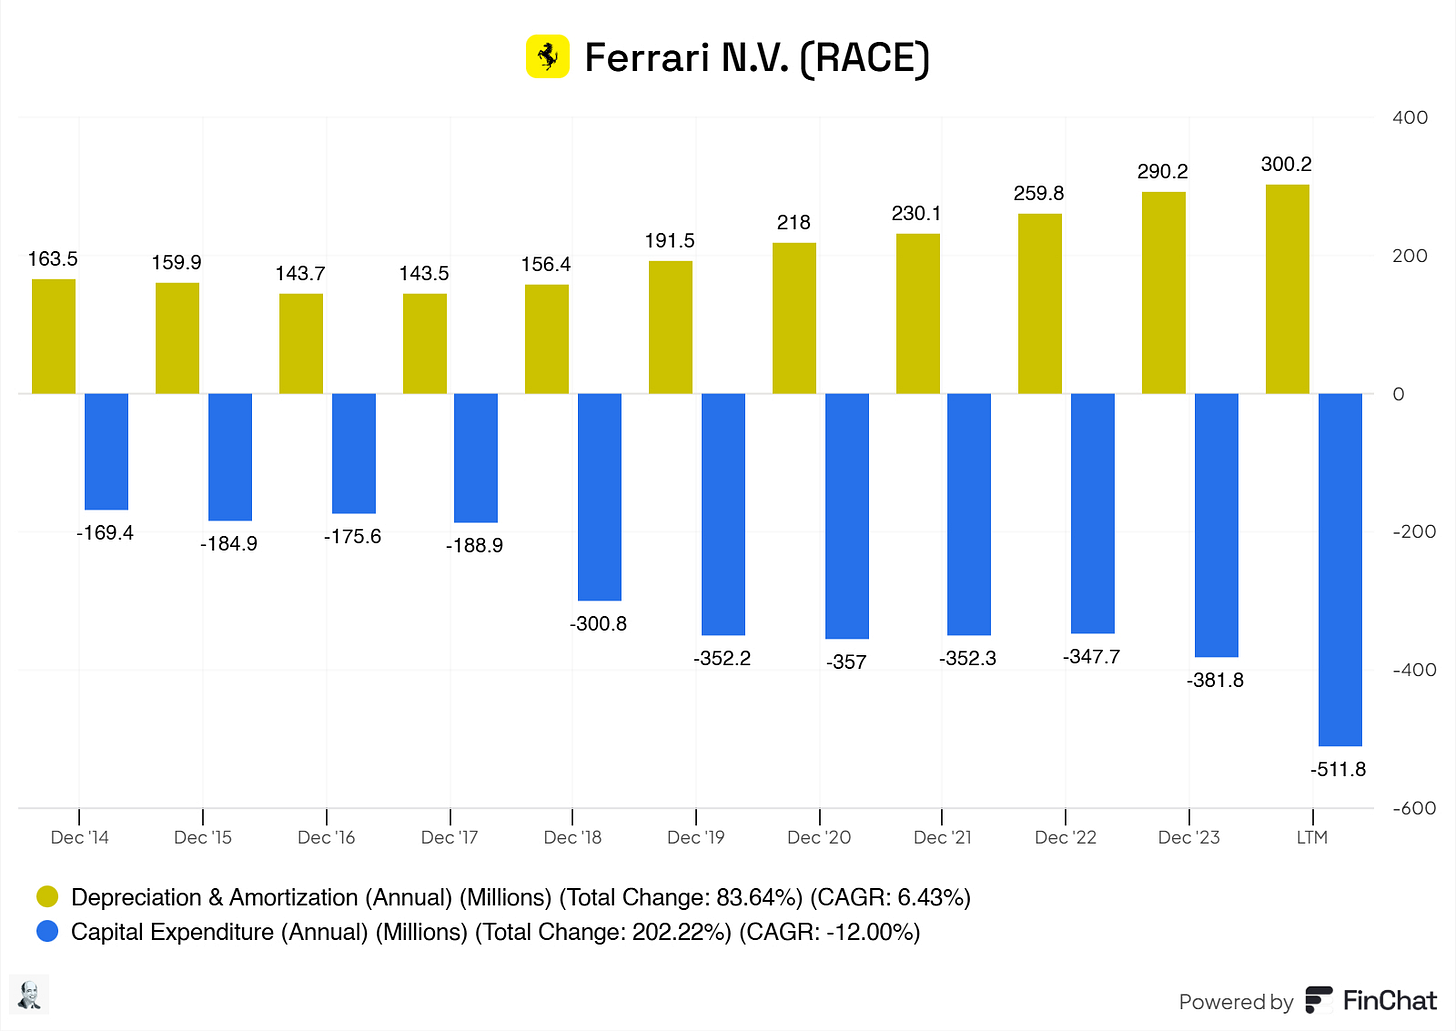
Removing depreciation and amortization from the CapEx, we get growth CapEx of (Ferrari reports in Euros):
2014: €5.9M (% of Total CapEx 3.48%)
2015: €25M (% of Total CapEx 13.52%)
2016: €31.9M (% of Total CapEx 18.17%)
2017: €45.4 (% of Total CapEx 24.03%)
2018: €144.4 (% of Total CapEx 48.01%)
2019: €160.7 (% of Total CapEx 45.65%)
2020: €139.0 (% of Total CapEx 38.93%)
2021: €122.2 (% of Total CapEx 34.68%)
2022: €87.9 (% of Total CapEx 25.28%)
2023: €91.6 (% of Total CapEx 23.99%)
LTM: €211.6 (% of Total CapEx 41.34%)
This indicates that Ferrari prioritizes growth investment over simple maintenance of existing operations.
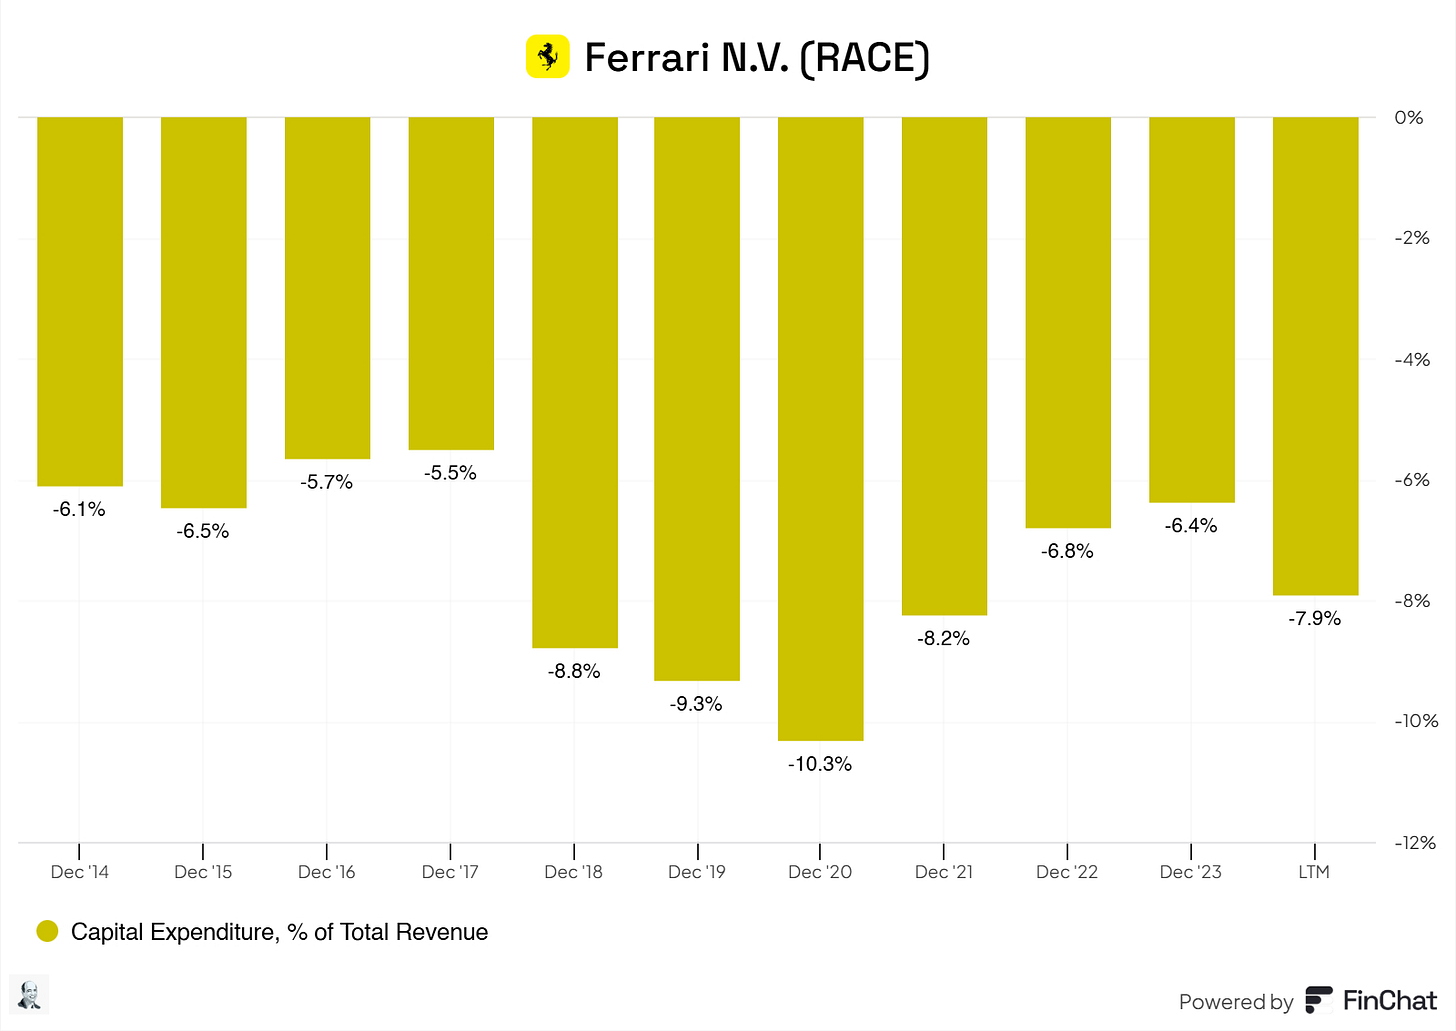
CapEx is, on average, 6.82% of Ferrari’s total revenue. But do remember, large chunks of this CapEx include growth CapEx! Therefore, it gives a twisted image here.
For instance, in 2018 and 2019, roughly half of the CapEx was Growth CapEx. So, the business seems to be heavy on CapEx, but this is due to Ferrari's expanding and growth nature.
Now, let us go over COGS for Ferrari.
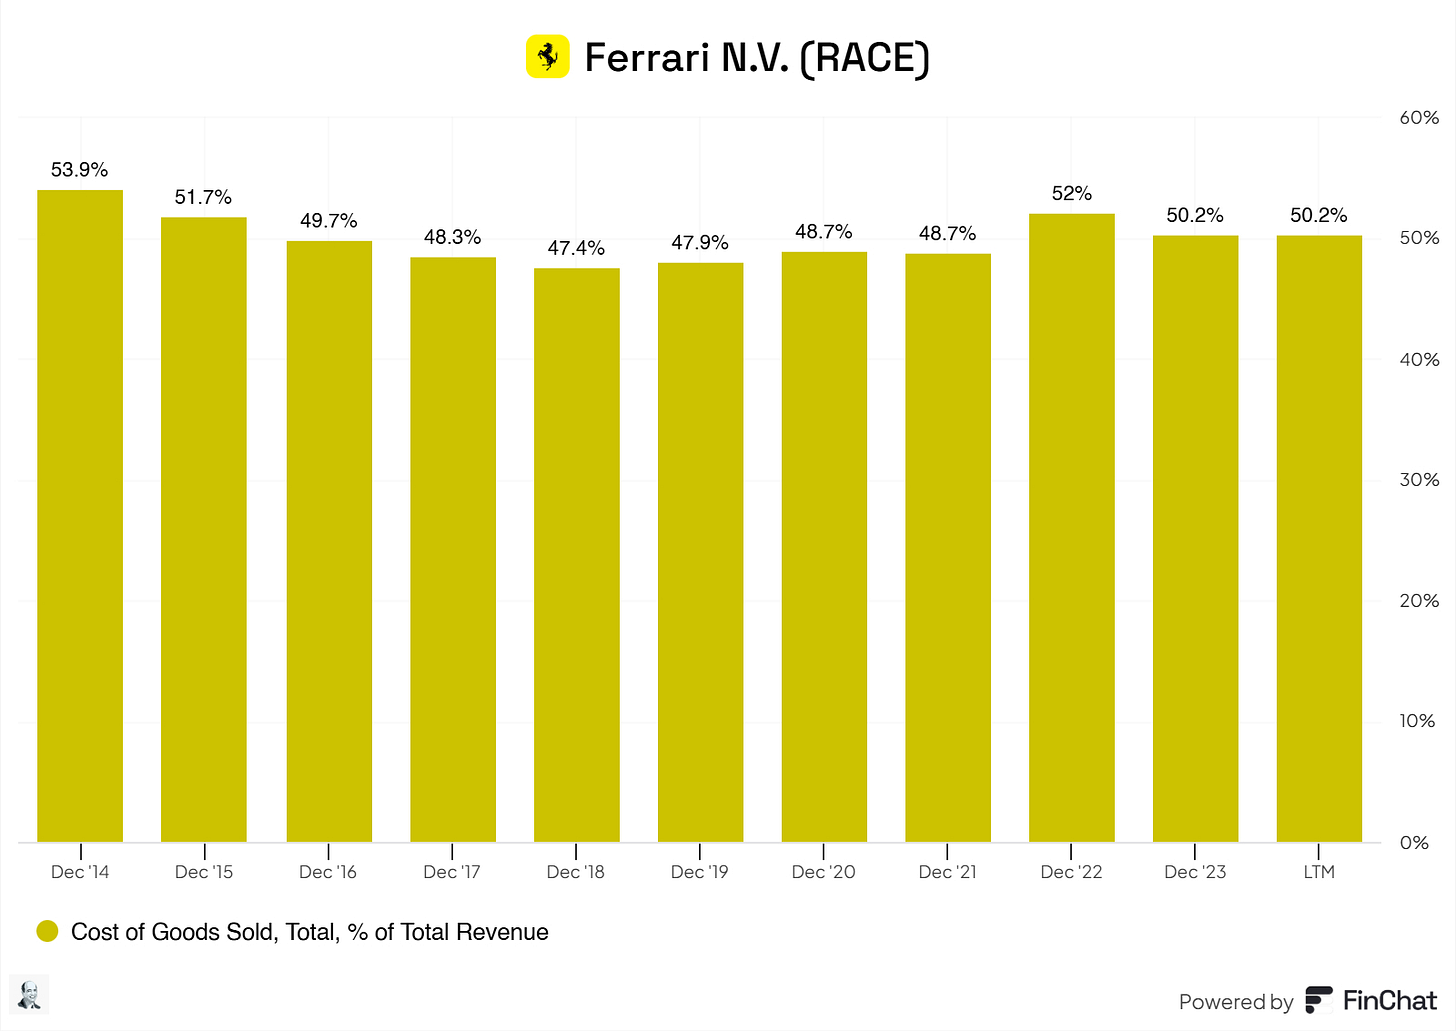
Ferrari has shown excellent stability over the past decade in the COGS. This indicates that Ferrari maintains consistent cost management relative to its revenue. This also suggests efficient production processes and cost control despite potential variability in material or production costs.
Now, let us look at SG&A costs for Ferrari.
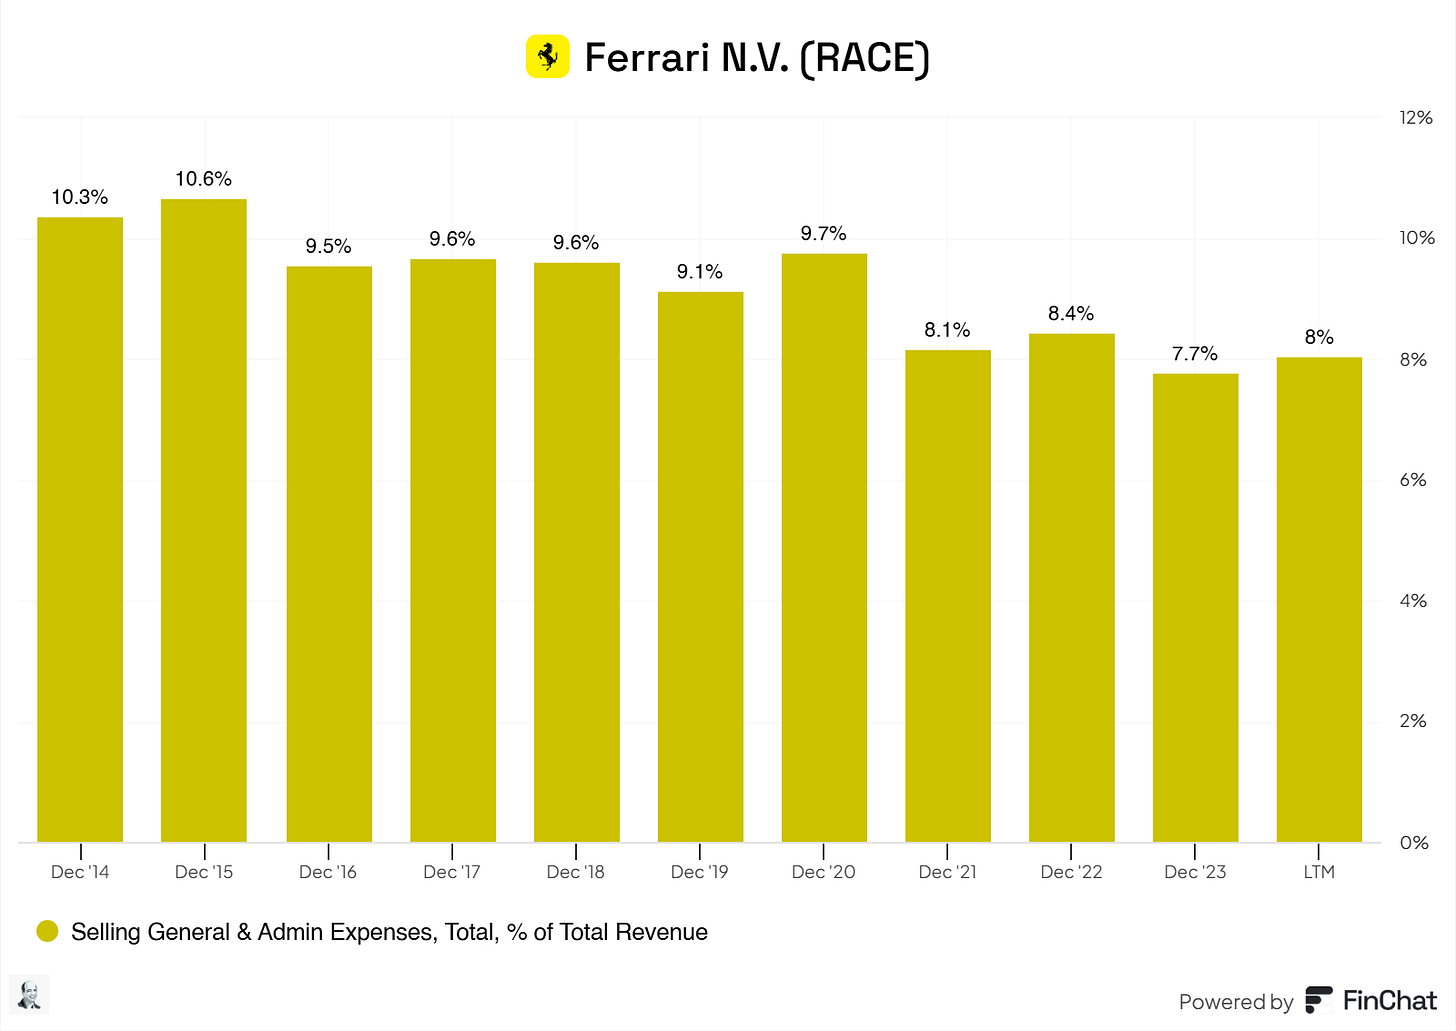
Ferrari’s SG&A costs are steadily declining, which is excellent! This is a positive sign of operational efficiency, improved scalability, and enhanced profitability. It also shows that Ferrari is leveraging its brand power to control costs without compromising its premium market position.
Let us head over to R&D.

It looks like R&D spending is decreasing, but that’s not the case. Take a look.
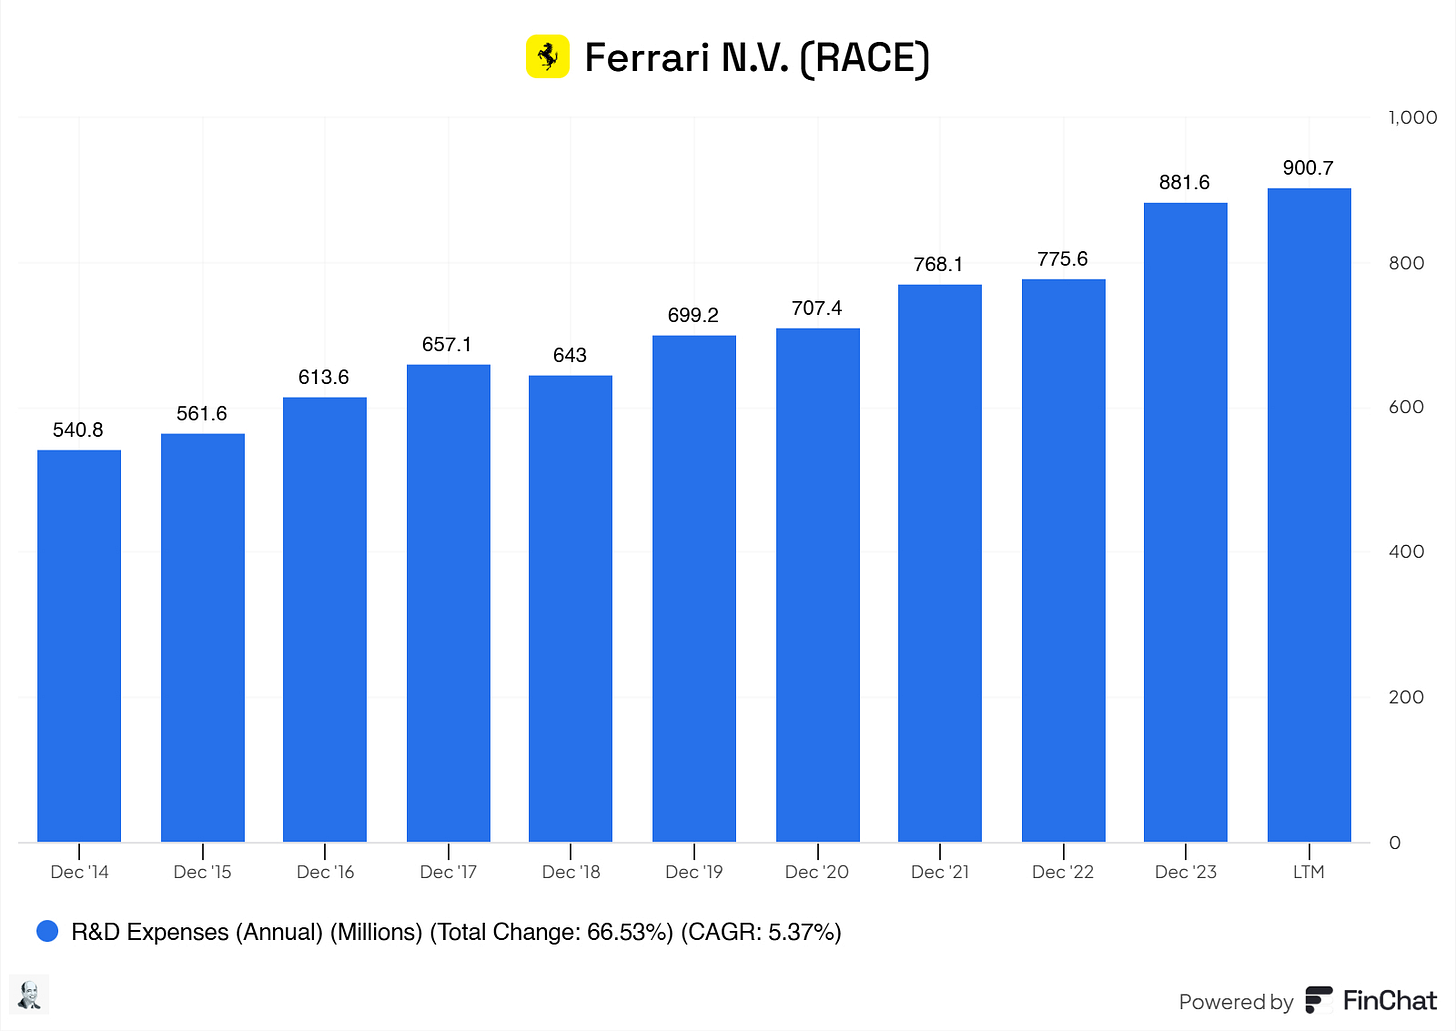
Revenue is growing faster than its R&D spending, thankfully. It is wonderful to see that Ferrari is continuing to research to compete in this competitive market. Although it is a leader, Ferrari has to keep innovating, and their R&D investment tells us investors that Ferrari is trying to. The declining R&D-to-revenue ratio signals Ferrari’s improved efficiency and ability to monetize its R&D investments, supporting its premium margins and scalable growth.
But do these R&D expenses translate into TSR (total shareholder return)?
The following formula is used to calculate if R&D is helping with TSR.
R&D efficiency score = Total Revenue Growth (%) / R&D spend (%) of the previous year
For example, if you have the x percentage of total revenue increase in 2022 over 2023, you divide that by the R&D Expenses as a % of Revenue from 2022. This should give you a score. Compared to the illustration above, this score should indicate how efficiently the company’s R&D is translated into higher revenue growth, therefore measuring its efficiency. Although the RDI is still in the moderate segment, there’s improvement, and Ferrari should continue improving its RDI score.
For Ferrari, it looks like this:
2014: 0.93
2015: 0.16
2016: 0.44
2017: 0.52
2018: 0.00
2019: 0.54
2020: -0.39
2021: 1.29
2022: 1.26
2023: 1.16
LTM: 0.80
Ferrari has been at the bottom half, but in the last couple of years, it has been in the second quartile, meaning that Ferrari’s R&D efforts are getting better!
8.2 Capital Efficiency Review
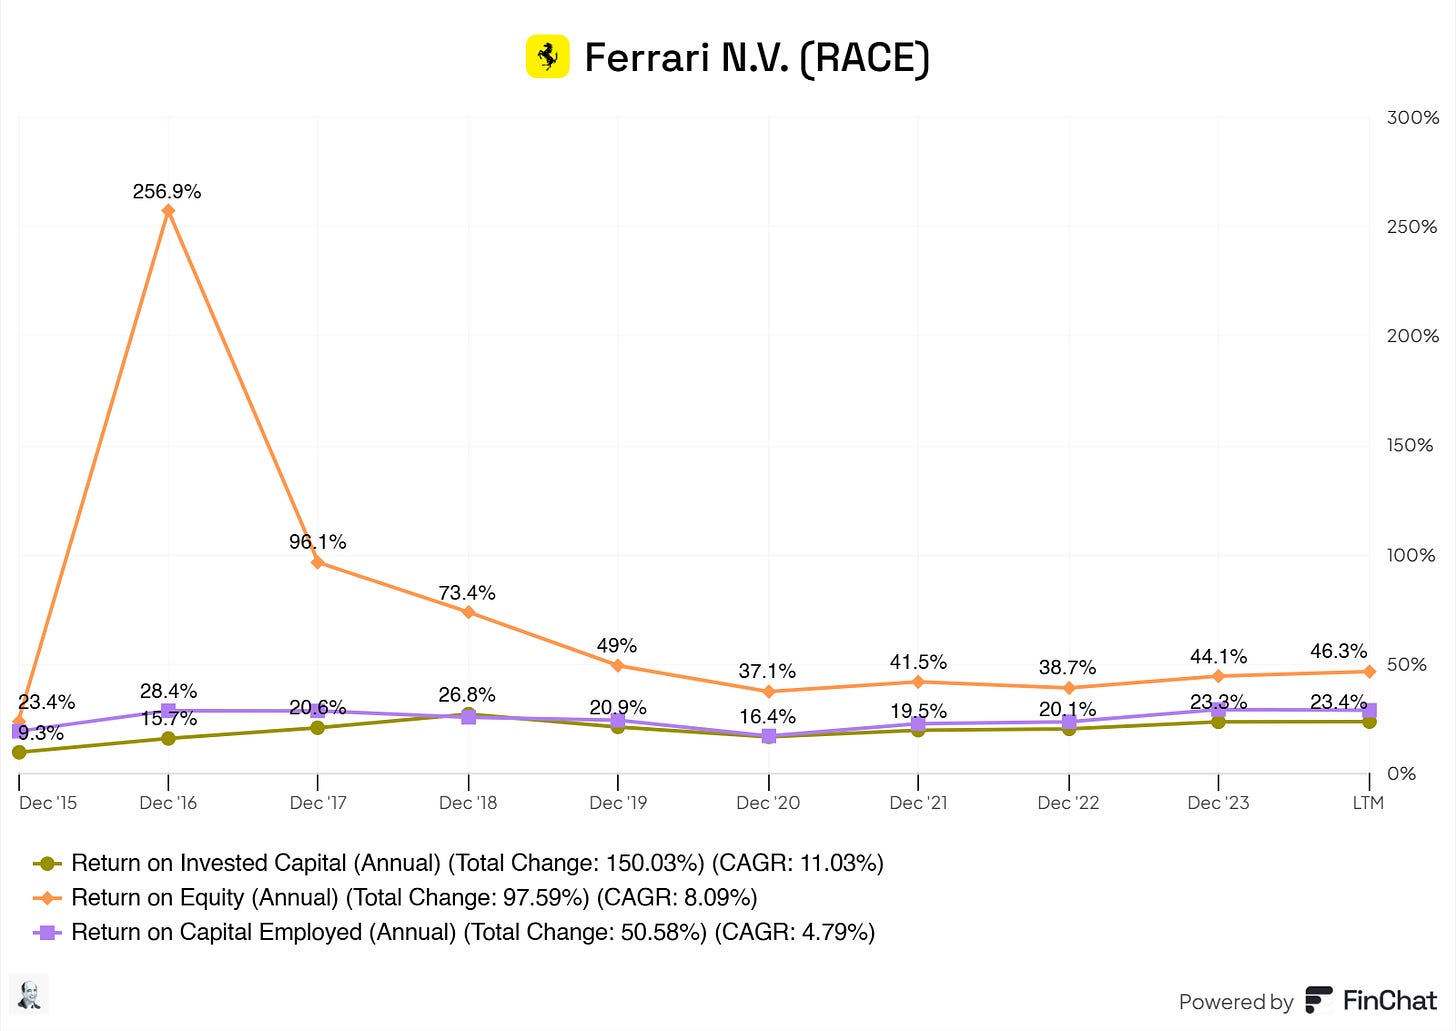
Ferrari has consistently generated strong returns on equity and invested capital. Its ROIC and ROCE have grown steadily. This tells investors that Ferrari effectively allocates resources to high-return projects, supporting its long-term profitability and growth.
9. Profitability Assessment
9.1 Profitability, Sustainability, and Margins
Here’s where the fun is!
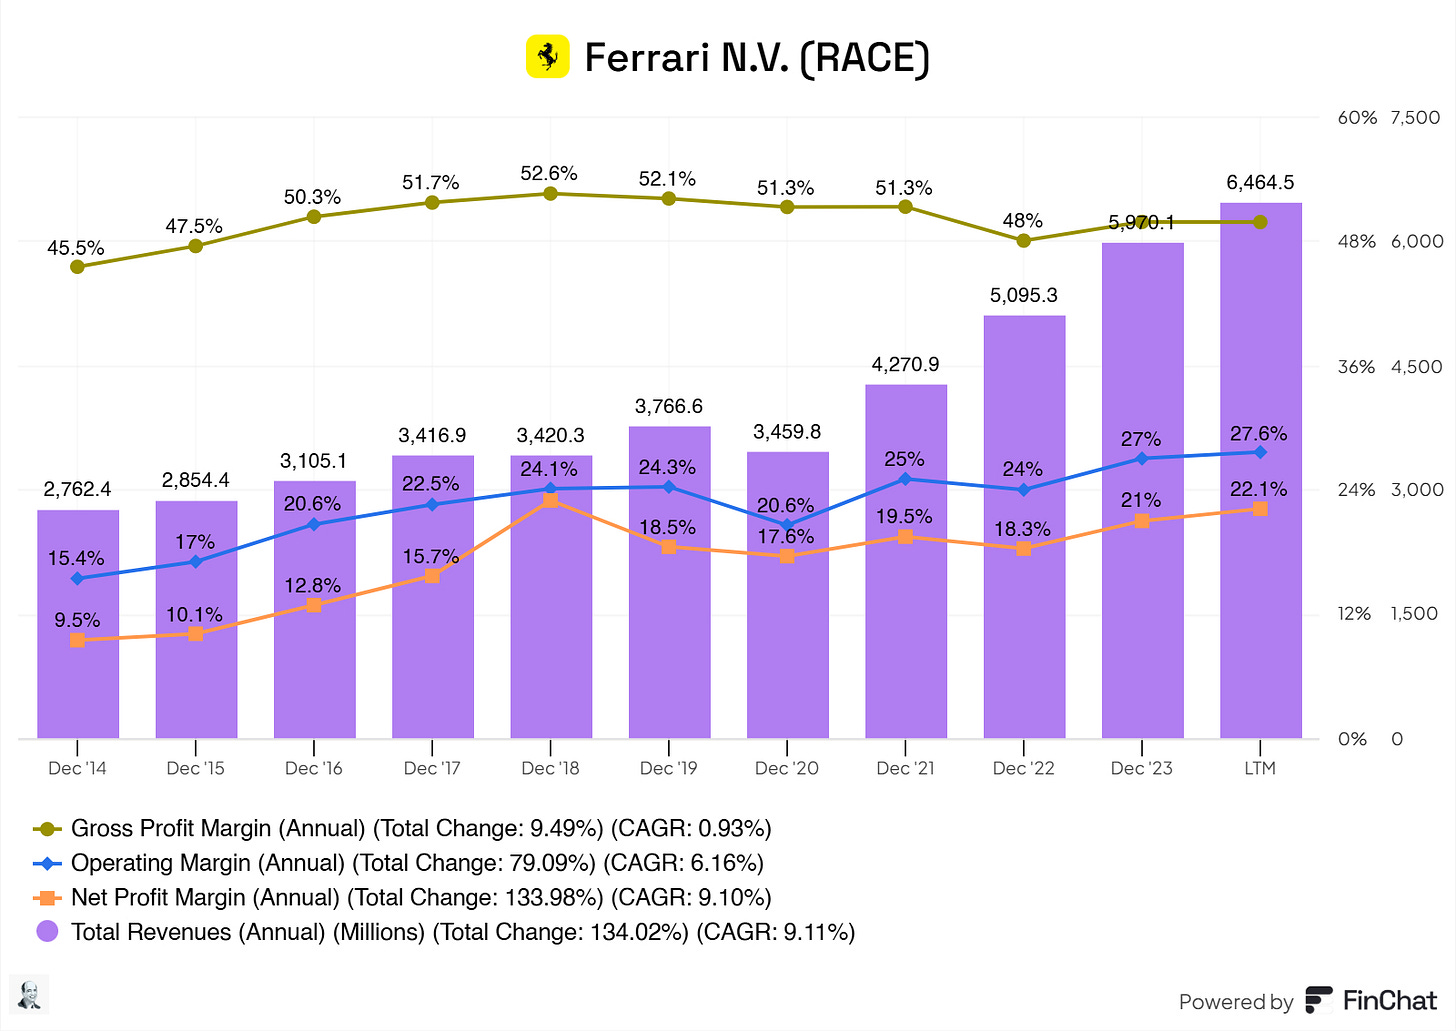
Ferrari is showing excellence across the board. It boasts excellent Gross Profit, Operating, and Net Profit margins. Do remember that this is an automotive company. There’s scarcity in these types of businesses with these types of margins. Ferrari’s margins are coming closer to SaaS companies’ margins—just pure excellence.
Ferrari is profitable and boasts excellent margins. Are these sustainable? Yes. History has shown that Ferrari can maintain and even grow its margins while simultaneously growing its total revenues.
Ferrari’s revenues are also high-quality.
Ferrari’s net income to FCF ratio is:
2014: 98.2%
2015: 181.5%
2016: 208.1%
2017: 88.5%
2018: 80.7%
2019: 137.1%
2020: 79.2%
2021: 112%
2022: 113.2%
2023: 106.6%
LTM: 101.1%
The Net Income to FCF percentage tells us how much of Ferrari’s accounting profit (Net Income) is turning into real cash (Free Cash Flow) that the company can use. Most of the time, Ferrari generates more cash than it shows a profit on its income statement.
9.2 Cash Flow Analysis
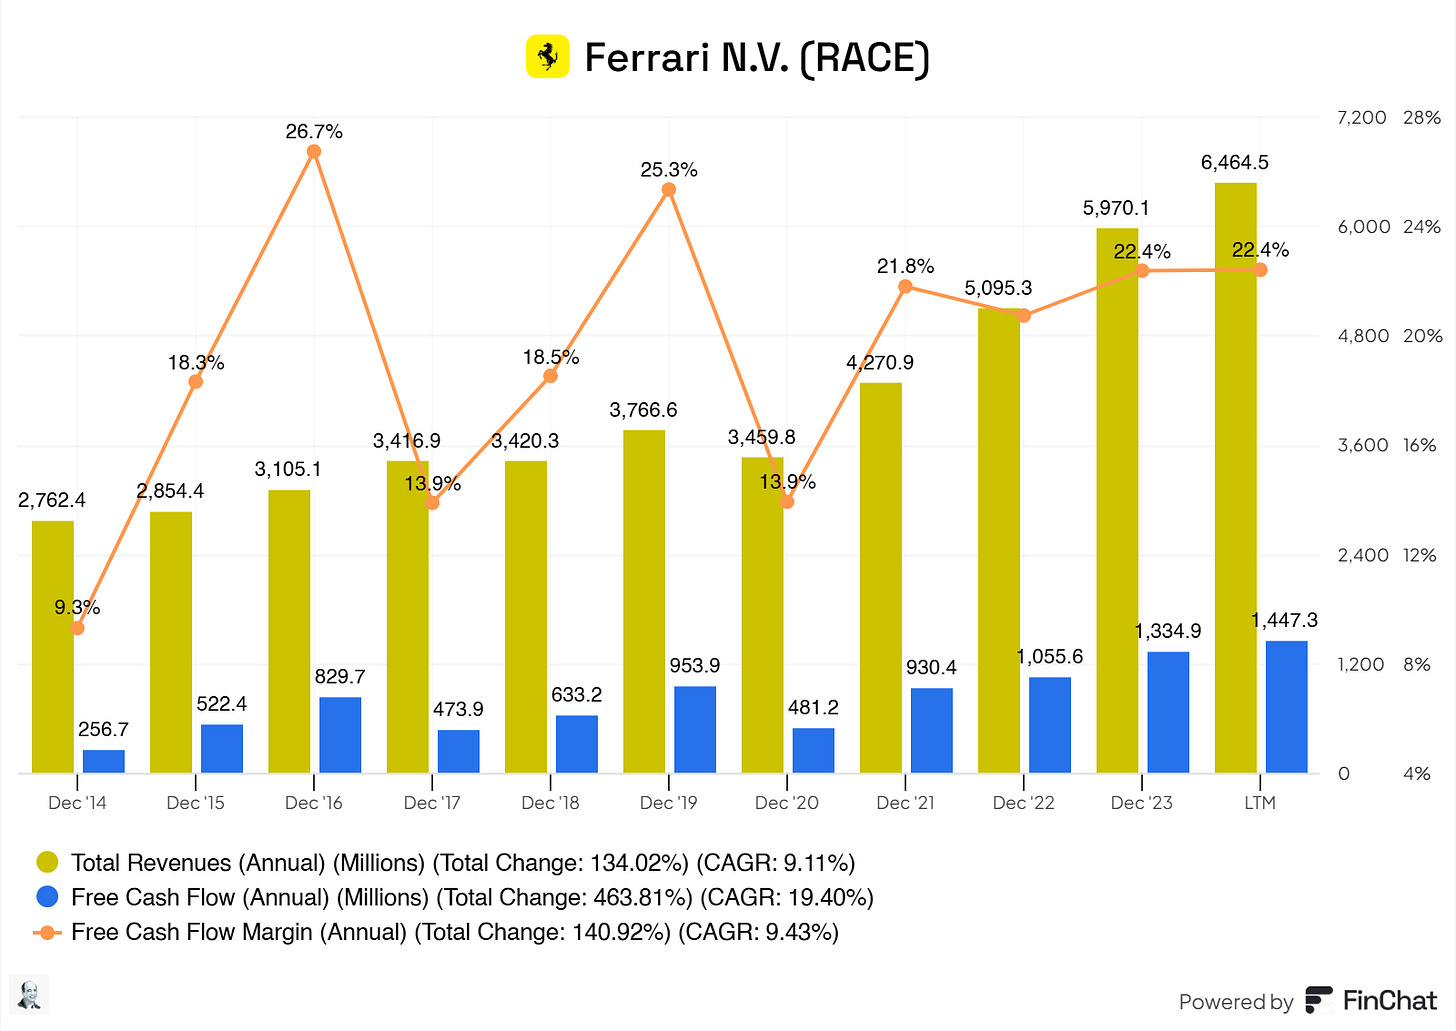
There’s nothing to complain about here! Ferrari boasts an excellent FCF margin, especially for a company in the automotive industry. The average FCF margin in this industry is roughly 5% to 10%.
For every dollar, LTM Ferrari converts $0.22 into free cash flow. Free cash flow can be used to their liking, like investing for growth or share buybacks. We love companies that can generate generous amounts of FCF from their total revenue.
The most beautiful thing is that Ferrari doesn’t do stock-based compensation. Making all their FCF truly FCF.
10. Growth Projections
EPS Fwd 2Yr CAGR: 13.99%
EPS LT Growth Est CAGR: 12.72%
Rev 5Yr CAGR: 11.9%
Rev 10Yr CAGR: 9.84%
Rev Fwd 2Yr CAGR: 9.37%
Excellent growth is expected for Ferrari’s EPS and revenue!
What is most important to me is what FCF we can expect in the future; let us check it out for Ferrari.
Ferrari is currently growing its FCF with a CAGR of 19.40%. I do expect that for the coming two years, Ferrari will grow at that rate, but a decline is inevitable. Therefore, I find a roughly 13% CAGR growth more reasonable at that scale. Taking these growth projections, the future FCF might look something like:
2025: €1,727.37 million
2026: €2,061.89 million
2027: €2,329.94 million
2028: €2,632.83 million
2029: €2,973.10 million
2030: €3,353.60 million
I like what I see so far, do you?
11. Value Proposition
11.1 Dividends Analysis
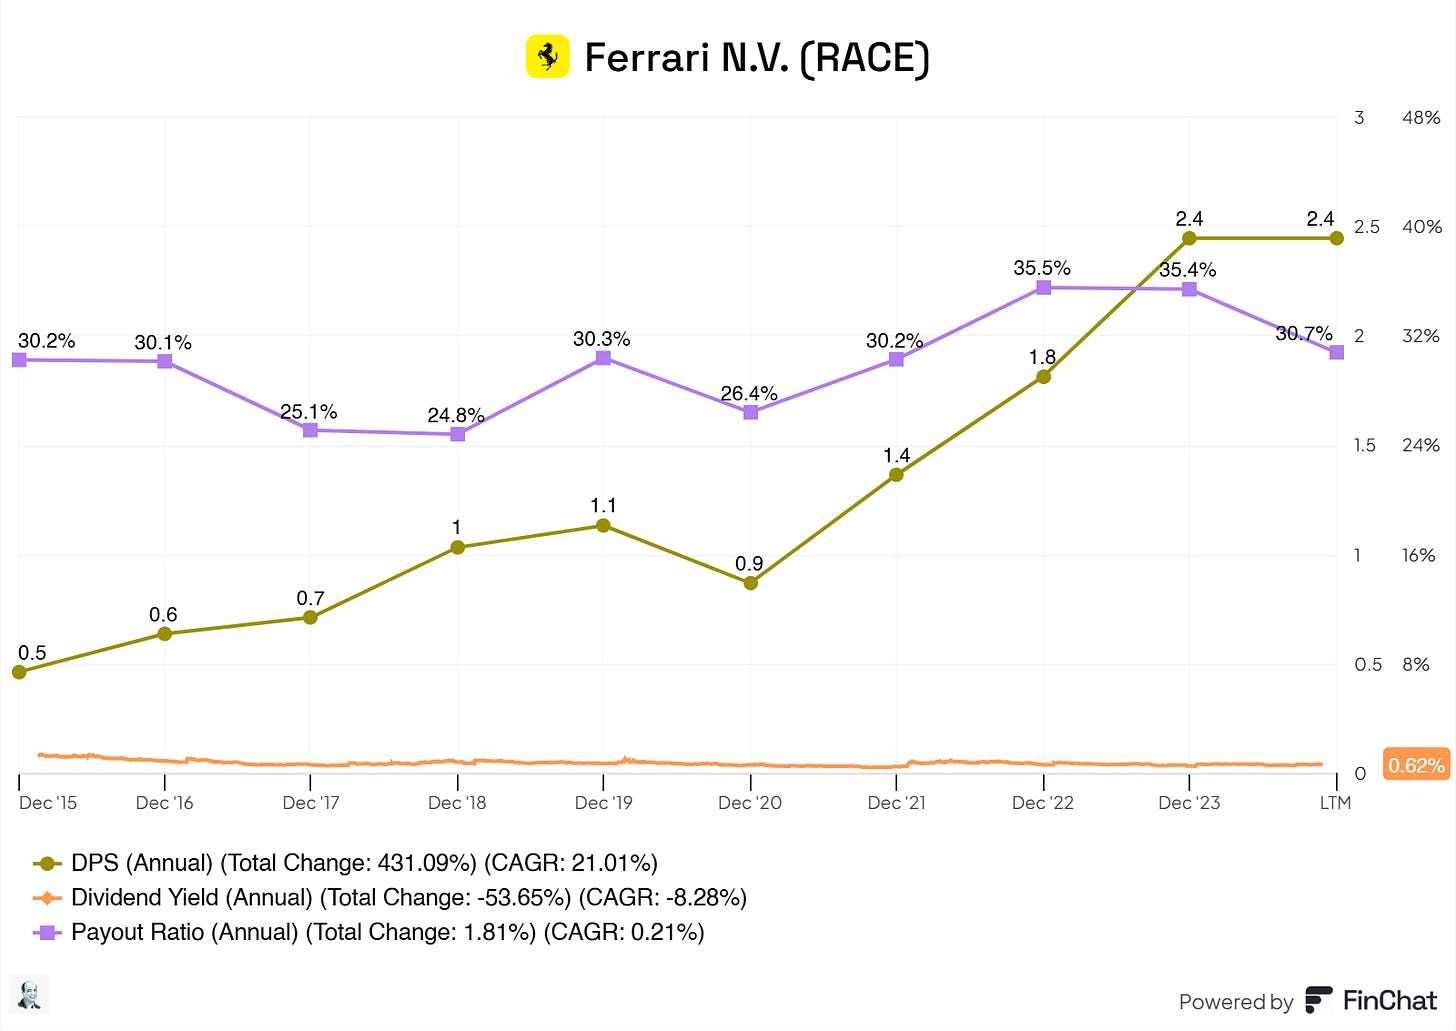
Ferrari pays a small dividend, which is nothing to write home about. This company should not attract dividend investors. But, it is good that Ferrari doesn’t pay a high dividend. Ferrari should focus more on pumping FCF back into the business rather than giving it to its shareholders. Ferrari boasts a high ROIC, ROCE, and ROE, so the capital will be better off with Ferrari to invest.
10.2 Share Repurchase Programs
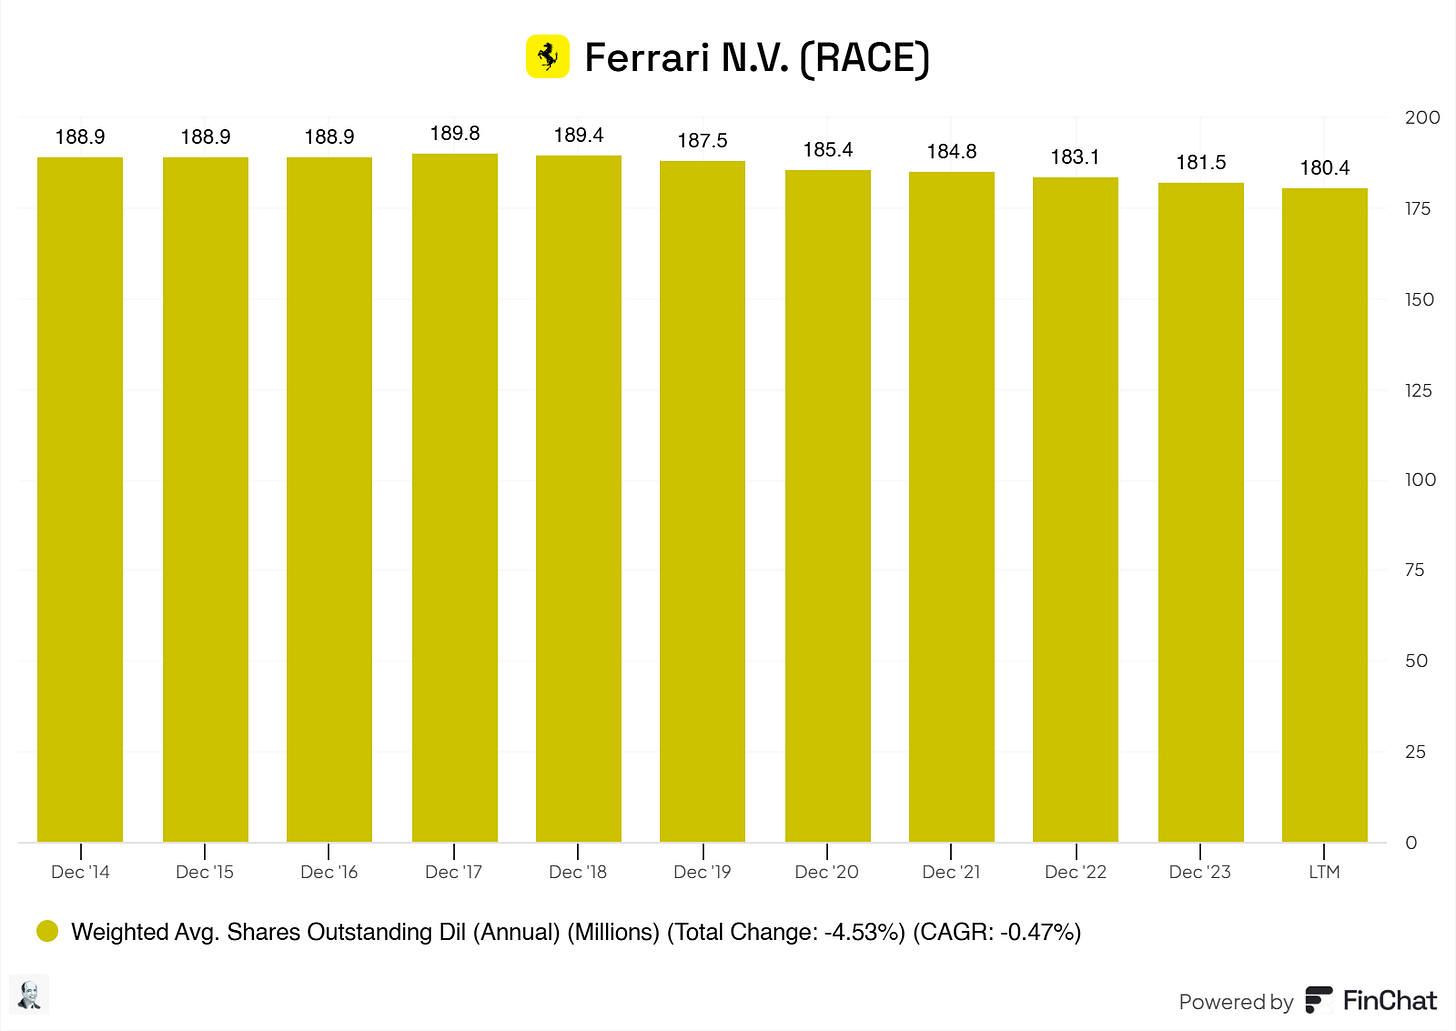
Ferrari repurchases its shares, although at slow rates.
Ferrari doesn't seem to time these purchases well, though. I do not see significant buying when the price (and valuation) are down, but buying along the way without considering the valuation.
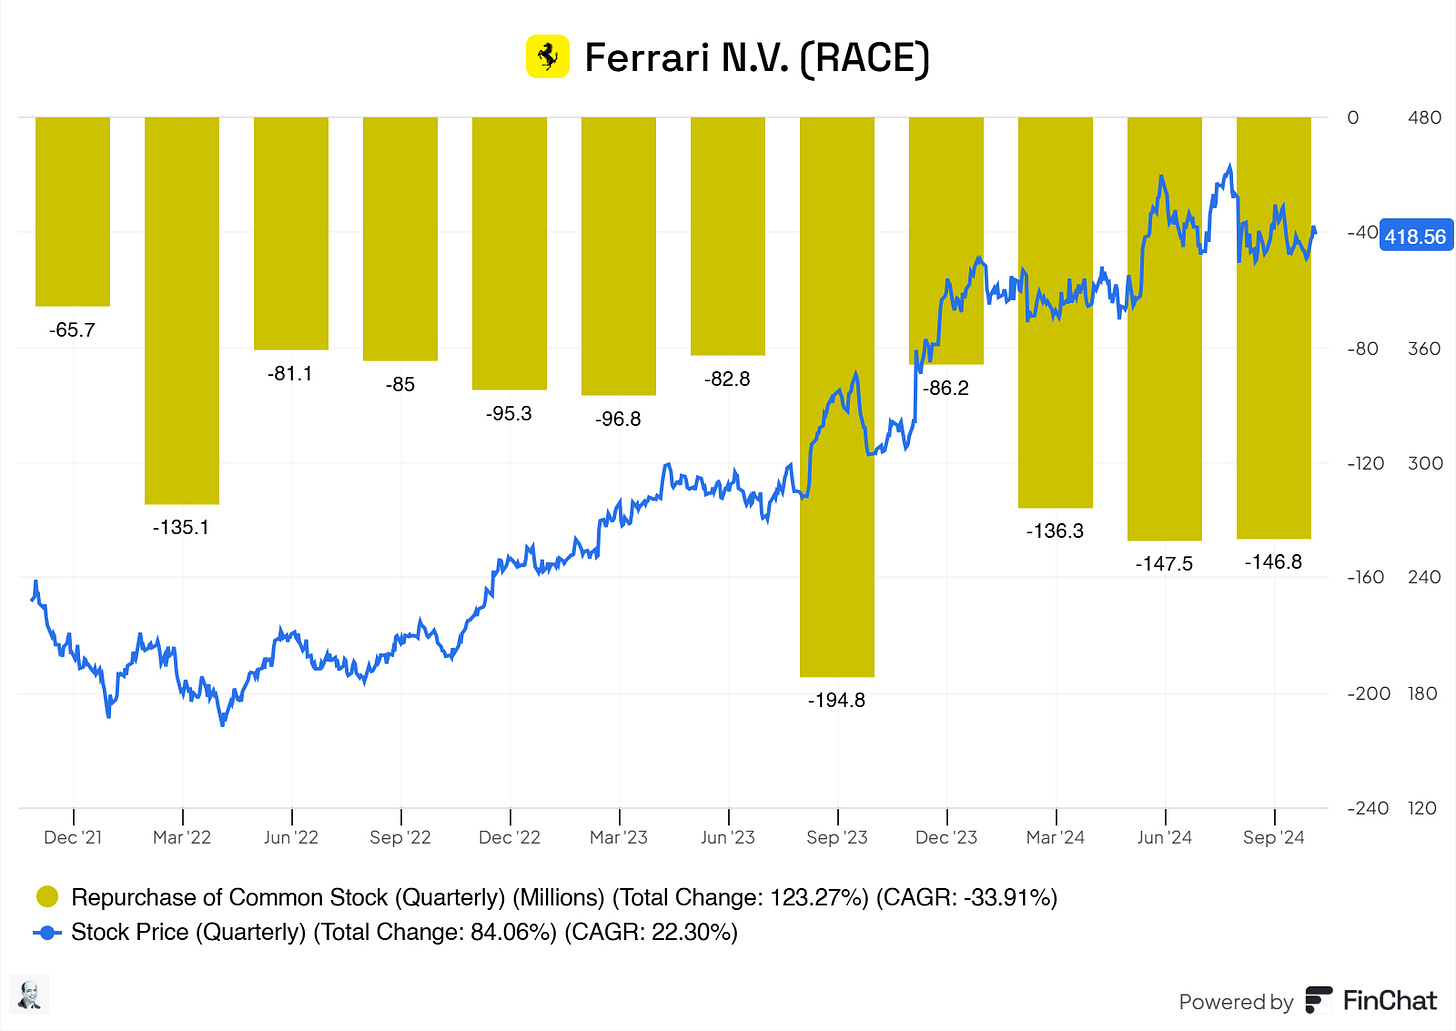
Let us see their buyback yield in comparison to their stock price.
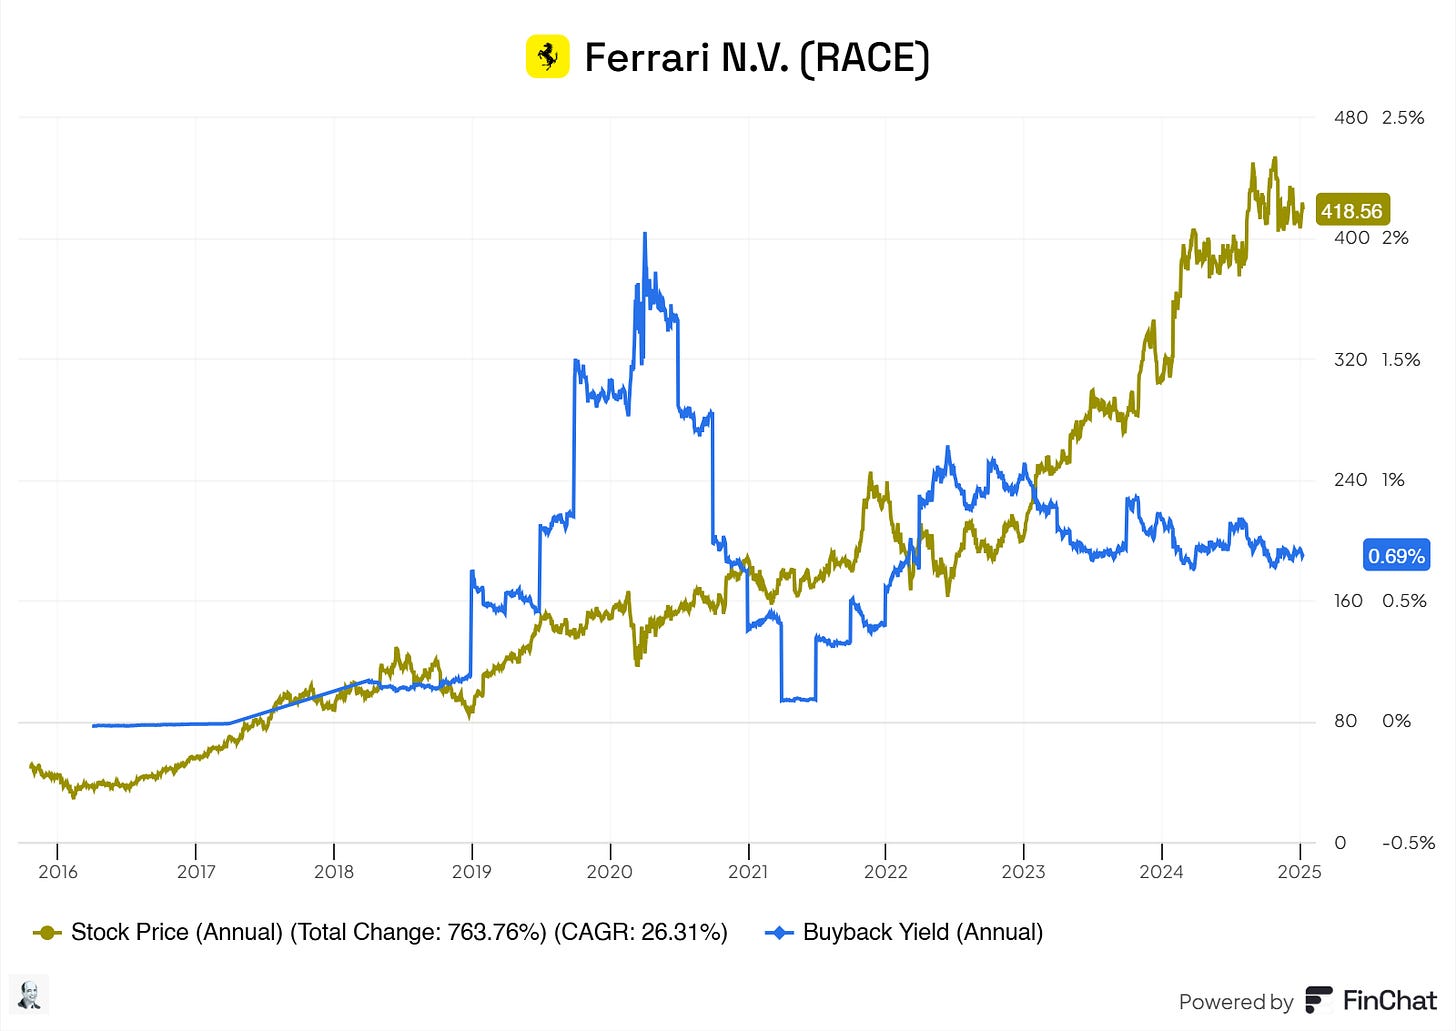
The increase in the buyback yield when the price declines indicates that Ferrari’s management does deploy capital when they think the stock price does not reflect the true value of the business; this is excellent.
We want to ensure that management doesn’t blindly buy back its shares; if it does, the business and its shareholders will not gain any added value.
11.3 Debt Reduction Strategy
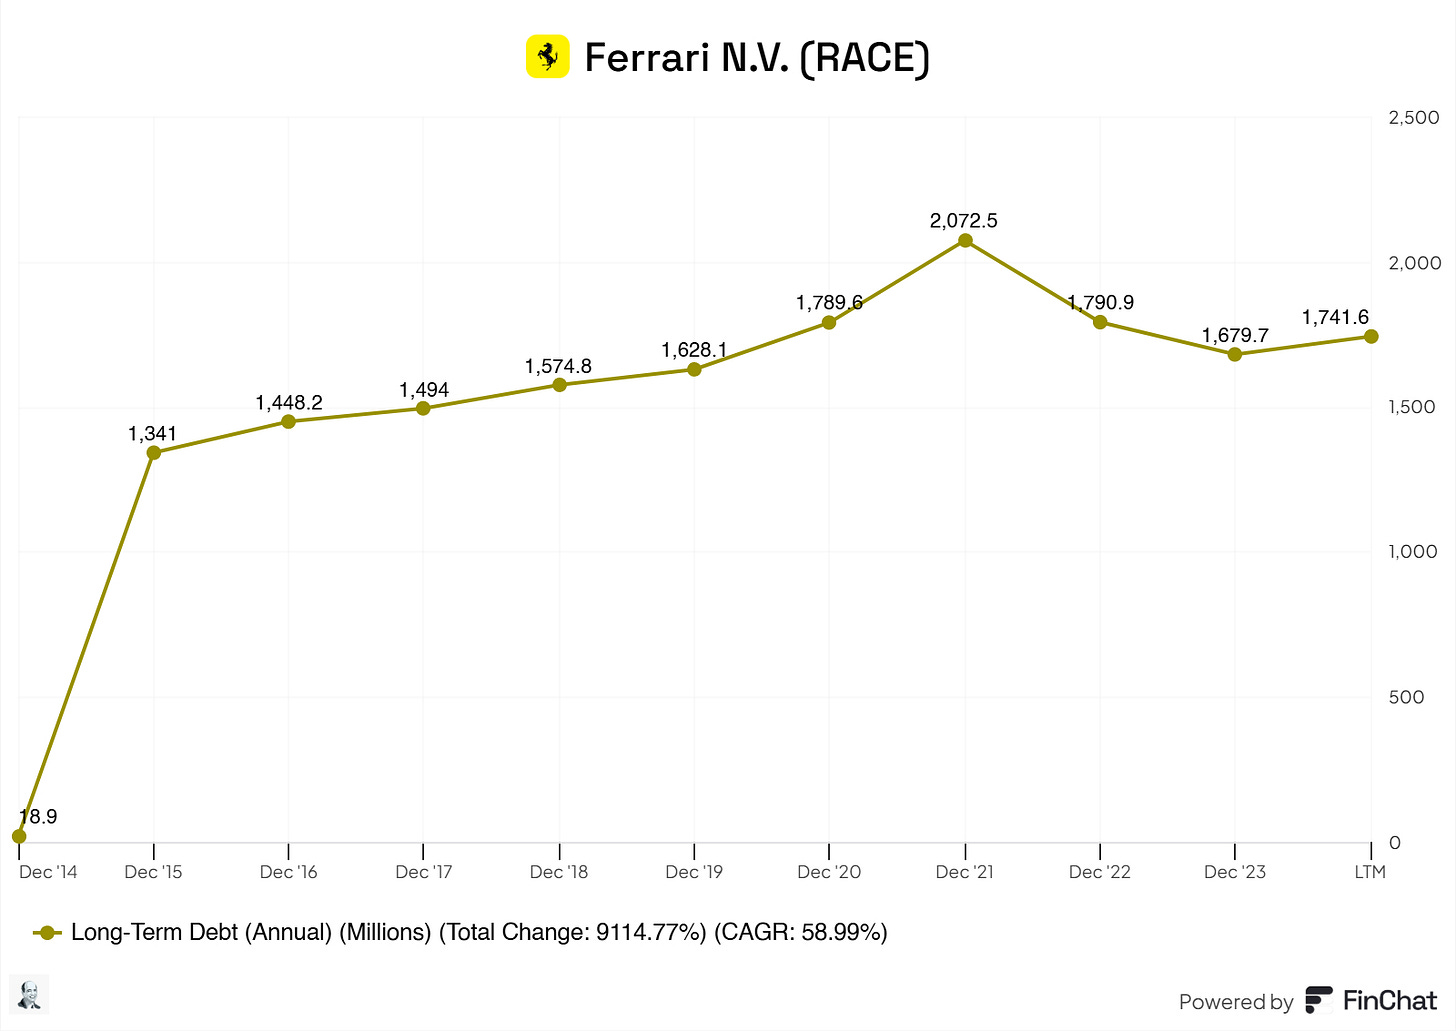
Since 2021, Ferrari has been reducing its debt position. Currently, Ferrari has a net debt of 1.594M, which is reasonable compared to its FCF. Therefore, the business has no real interest strain; Ferrari boasts an EBIT/Interest of 50.49x.
12. Quality Rating
Ferrari scores a 9 on the quality rating!
I didn’t expect anything else; what an excellent business.
13. Valuation Assessment
Let us crunch up some numbers!
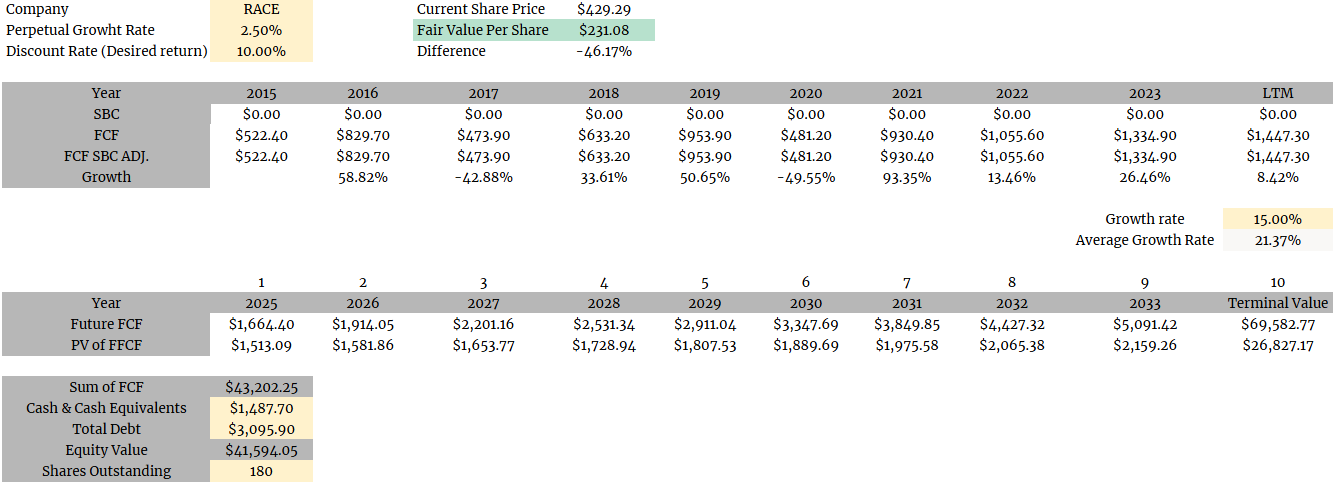
A simple DCF gives us a price for Ferrari of $231.08 per share.
Let us now use my favorite, the reverse DCF.
According to the reverse DCF, 21% YoY growth for 10 years is calculated in the price.
Ferrari is overvalued. I expect solid FCF growth, but 21% year over year for the coming 10 years is impossible.
Do you want to go even deeper?
If you enjoyed this breakdown of Ferrari and found the insights helpful, I’ve got even more tools to help you make smarter investment decisions:
A spreadsheet with ALL the high-quality stocks on my radar?
A personalized investment case just for you?
Or a 30-minute Zoom call to discuss anything investment-related?
Here’s how you can get them—completely free. Simply refer a friend using my new referral program; these bonuses are yours!
Click below to get started and level up your investing game!
Useful Sources
Finchat: Financial Data (get it with 15% off using my affiliate link)
Buy Me a Coffee: If you want to support my content, you can buy me a coffee! All the upbringings will go to improving the newsletter, of course.
Disclaimer
I do not own Ferrari shares and do not intend to buy any within the next six months.
By reading my posts, subscribing, following me, and visiting my Substack, you agree to my disclaimer, which can be read here.





Hi FluentInQuality, thank you so much for the article, it was an excellent read.
Like Bald, I have a question about your valuation as well.
In your reverse DCF you assume a terminal growth rate of 2.5%. Do you think this is reasonable? Why would it only be 2.5% for a luxury company? Look at Hermes, they are nearly 200 years old and currently growing in high single / low double digits.
What happens to your reverse DCF if you change the terminal growth to 6%, 8%, or 10%? It'd be an interesting exercise to see what the market is pricing in.
Great analysis overall but I'm a bit confused by your DCF calculations.
Perhaps I'm missing something but didn't you calculate that the average growth rate from 2015-2023 was 21.37% but then claiming in your reverse DCF that 21% YOY growth for the next decade would be impossible?