Hello, friends! 👋
If you missed my previous articles, you can catch up on them here:
If you haven't already, consider following me for more FREE content to enhance your investment journey. Whether you're a beginner or an advanced investor, you'll find valuable insights to help you make informed decisions. 😊
Table of Contents
Portfolio Overview
1.1 Total Portfolio Value
1.2 Performance Overview (Year-to-Date)
1.3 Allocation BreakdownRecent Transactions
2.1 New Acquisitions
2.2 Stocks Sold
2.3 Rationale for Each TransactionStock on the Watchlist
Outlook
Conclusion
Before we start, I would appreciate your filling out this poll. All votes are 100% anonymously.
June has been a relaxing month for me. As some of you might know, I’ve been to Malta to take some time off, a small vacation. Due to my being in Malta for most of June, I did not open new positions or close any positions in my portfolio.
Nevertheless, let us take a closer look at my portfolio!
Portfolio Overview
1.1 Total Portfolio Value
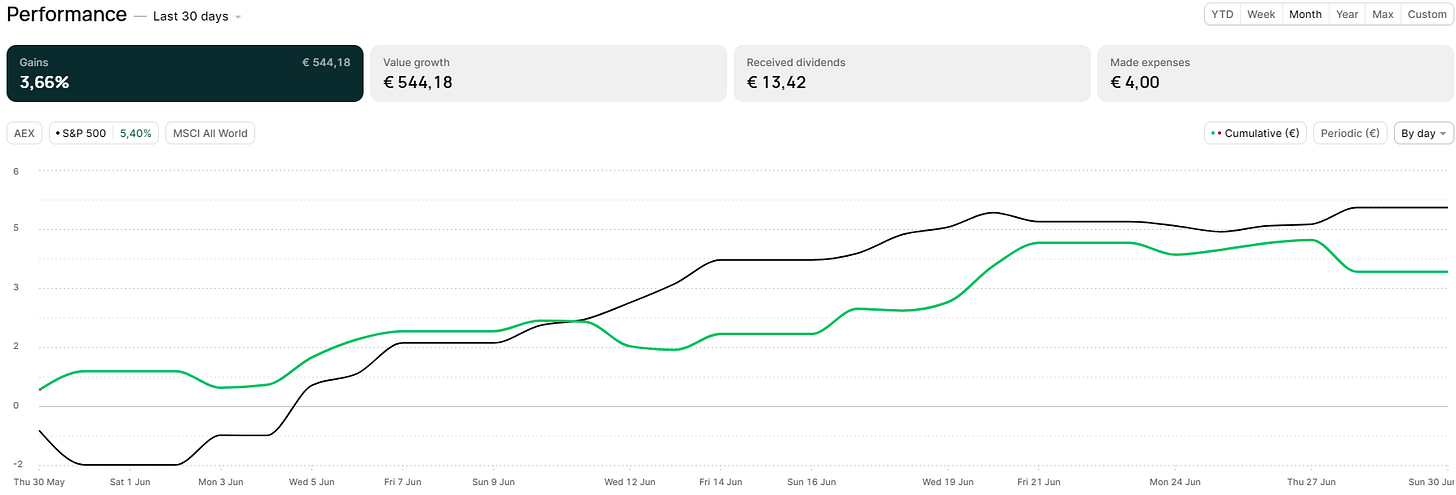
My current portfolio value is €15.431,25. In June, my portfolio gained 3.33%, while the S&P 500 gained 5.40% over the same period.
As mentioned in my previous portfolio update, I could see more months of underperformance compared to the S&P 500. Due to reallocations and my refined strategy, I am handing over gains in the shorter term, which is fine. My goal is for the longer term to have an outperformance.
1.2 Performance Overview (Year-to-Date)
Unfortunately, YTD, I’m underperforming badly compared to the S&P 500. This was expected because I refined my investment strategy and reallocated my cash to different holdings, which made me more active.
Although I did expect some degree of underperformance, I did not expect it to be by 12.90% as of today! In my worst-case scenario, I had hoped for a maximum of 4%-5%. As we can see, I almost tripled this. This gave me a reality check on how I performed, managed my emotions, and what works and what doesn’t. I have realized these things with these updates and can move on to become a more efficient investor, thankfully.
1.3 Allocation Breakdown
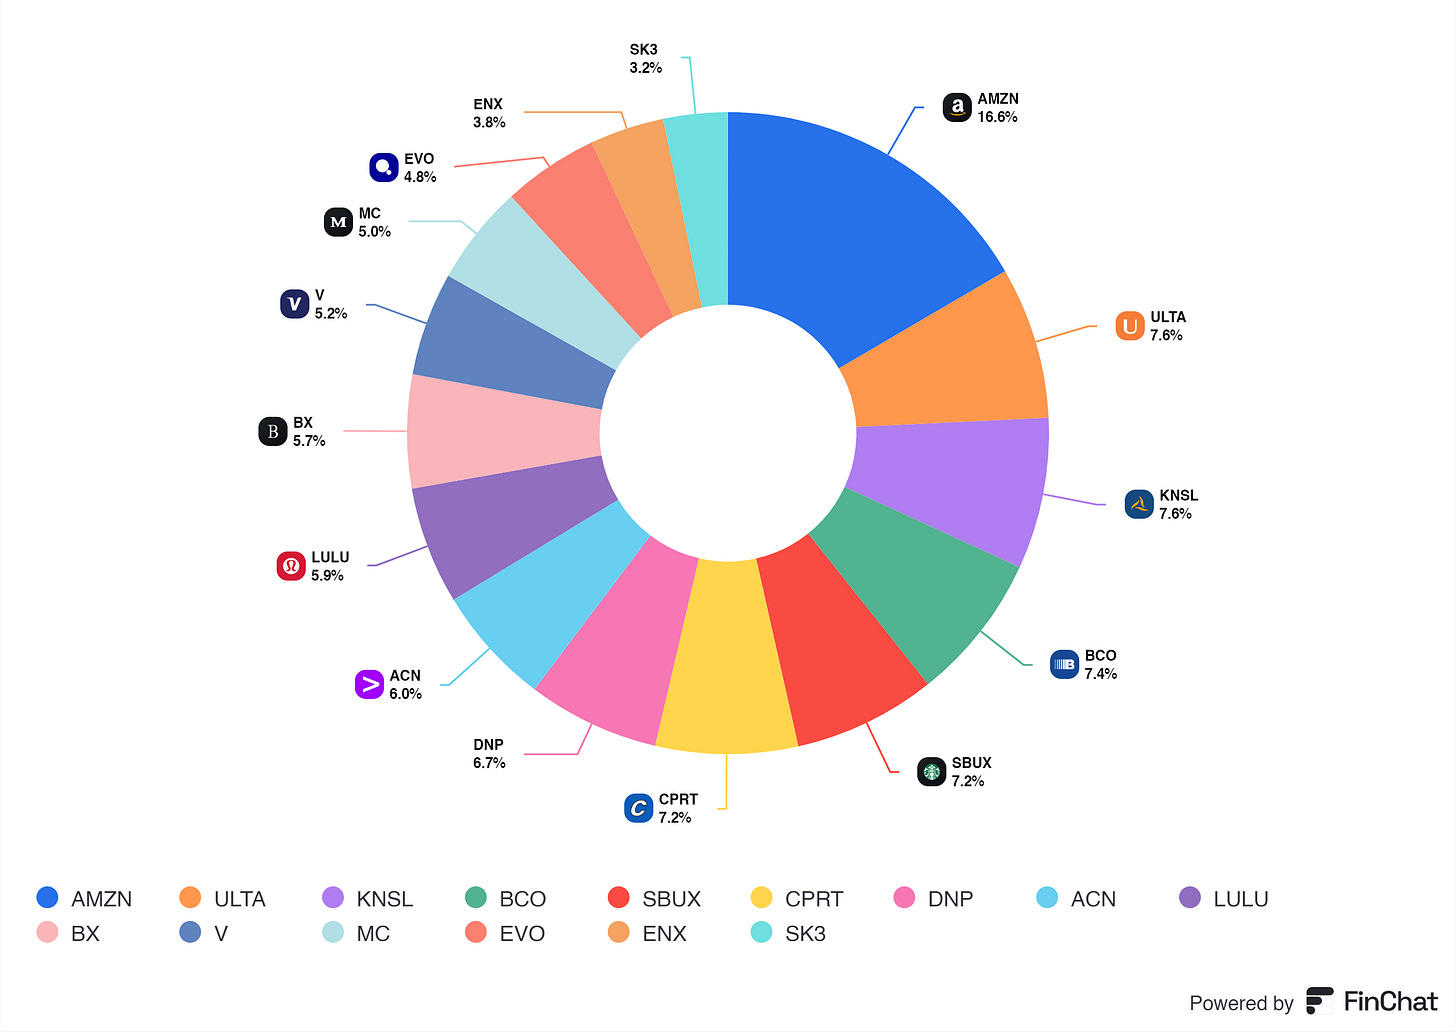
As shown above, my stock positions are spread almost evenly. I do not own any bonds.
I’ve read about having positions smaller than 3% and having no use in being in a portfolio, which I almost completely agree with. Therefore, I shifted, and still am shifting, to make the smallest position, about 4%. This requires me to reallocate more, and I will continue doing so in the coming months.
Adobe, you can see the average on some metrics from my portfolio; let us review some of them! :-)
Market Cap ($418.27B) and Total Enterprise Value ($453.04B): This suggests that my portfolio comprises large-cap stocks, typically well-established companies.
Dividend Yield (1.02%): This indicates that my portfolio has a modest focus on dividend income. The yield is relatively low, suggesting a focus on growth rather than income.
Revenue 5Y CAGR (18.27%) and Revenue 3Y CAGR (18.23%): My portfolio companies have had strong revenue growth over the past 5 and 3 years, suggesting they are expanding rapidly.
EBITDA Margin (27.99%), Operating Margin (23.95%), and Net Profit Margin (18.6%): These margins indicate that the companies in my portfolio are generally profitable with strong operational efficiency.
Return on Equity (22.06%), Return on Invested Capital (17.57%), and Return on Assets (12.62%): High returns indicate that my companies are effectively using their equity and capital to generate profits.
Forward P/E (24.49) and Forward P/FCF (24.44): These ratios suggest that my portfolio stocks are trading at a premium, which is typical for companies with strong growth prospects.
Diluted EPS 10Y CAGR (30.6%) and Net Income 10Y CAGR (31.01%): High earnings per share and net income growth over the past 10 years indicate strong financial performance and growth potential.
Gross Profit Margin (50.61%): This high margin suggests that the companies have a significant competitive advantage and can sell products at a good markup.
CapEx to Revenue (0.05): This indicates a low capital expenditure relative to revenue, which could mean the companies in my portfolio are less capital-intensive.
Free Cash Flow per Share ($10.77) and Free Cash Flow Margin (23.1%): My portfolio companies generate substantial free cash flow, which can be used for dividends, buybacks, or reinvestment.
Net Debt ($16,501.06M): A relatively manageable level of net debt, given the high market cap and TEV, indicating solid balance sheets.
EPS ($8.85): Reflects the earnings power of your portfolio companies on a per-share basis.
Recent Transactions
2.1 New Acquisitions
In June, I only added Adobe to my portfolio; as we speak, Adobe is up 23,12%. I bought Adobe before its earnings. After Adobe released its earnings soared 15%, lovely coincidence there. ;-)
2.2 Stocks Sold
I sold out of Ingersoll Rand to free up space for Adobe.
2.3 Rationale for Each Transaction
In my new investment strategy, Ingersoll Rand was no longer a quality business with its current fundamentals. The stock price was soaring, but the underlying fundamentals did not support this.
I saw Adobe trading at a fair value of around €455,78. After a deeper dive into the fundamentals, future growth, industry, management, and possible headwinds, I decided to invest in Adobe. Adobe is a powerhouse of a business, and I’ve always wanted to add this powerhouse to my portfolio. I am pleased that I’ve taken the right steps to do so.
Stocks on My Watchlist
I’m sorry to disappoint you here, but there’s nothing on my watchlist. :-)
Outlook
There will be some minor changes to my portfolio allocation since I have smaller positions, which I do not consider an added benefit.
I’m scouting stocks to see if I can find another quality compounder at a reasonable value to add to my portfolio, but for now, it will be a quiet month.
Conclusion
June has been my most relaxing month, especially regarding the transactions and outlook.
From a performance perspective, I’ve noticed that, as mentioned earlier, I need to dive deeply into my emotional state. I am more than pleased with the road ahead of me, and I’m eager to see what next month will bring.
Disclaimer
By reading my posts, being subscribed, following me, and visiting my Substack, you agree to my disclaimer. You can read the disclaimer here.


Very interesting! I like your portfolio. The poor performance of stocks like Starbucks en Lululemon aren’t helping your performance, but longer term they look excellent.