
S&P Global: A Top-Tier Compounder – Is Now the Time to Buy?
Since 1990, a 12.9% CAGR, outstanding returns on capital, a free cash flow powerhouse, and above all—an unstoppable near-monopoly with an impenetrable moat.


It’s been a while since my last investment case—my apologies.
To make it up to you, I’m bringing an absolute powerhouse to your attention.
Few companies hold the strategic dominance that S&P Global commands in the financial world.
As a near-indispensable player in:
Credit Ratings
Market Intelligence
Indices & Data Analytics
SPGI thrives on recurring revenue, pricing power, and deep industry entrenchment.
With a history of high-margin growth, a 12.9% CAGR since 1990, and a fortress-like moat, this isn’t just another financial services company—it’s a critical infrastructure provider for global markets.
Despite macro uncertainty, SPGI continues to compound wealth, leveraging its asset-light model and free cash flow generation to drive shareholder returns.
Without taking more of your valuable time. Let’s go over this quality compounder.
Happy reading!
One last thing!
If you want more investment cases, click here.
This is every investment case I’ve published so far.
Table of contents
Corporate Analysis
1.1 Business Overview
1.2 Revenue Breakdown
1.3 KPIsExecutive Leadership
2.1 CEO Experience
2.2 Employee Satisfaction Ratings
2.3 CEO Value CreationInsider and institutional ownership
Competitive and Sustainable Advantages (MOAT)
Industry Analysis
5.1 Industry Growth Prospects
5.2 Competitive LandscapeRisk Assessment
Financial Stability
7.1 Asset Evaluation
7.2 Liability AssessmentCapital Structure
8.1 Expense Analysis
8.2 Capital Efficiency ReviewProfitability Assessment
9.1 Profitability, Sustainability, and Margins
9.2 Cash Flow AnalysisGrowth Projections
Owner Earnings & Expect Annual Return
Value Proposition
11.1 Dividend Analysis
11.2 Share Repurchase Programs
11.3 Debt Reduction StrategiesQuality Rating
Valuation Assessment
1. Corporate Analysis
1.1 Business Overview
By now, you know the drill—do we understand the business and how it generates revenue? If we can answer that, we have a solid grasp of the company.
S&P Global is a key player in the global financial system, providing credit ratings, financial data, market intelligence, and indices that corporations, investors, and governments rely on daily.
Its dominance is built on:
A strong competitive moat
Pricing power
Indispensable services with high switching costs
How does S&P Global generate its revenues? Simple!
Credit Ratings
As one of the Big Three rating agencies (alongside Moody’s and Fitch), SPGI earns fees every time a company, government, or institution issues or maintains a credit rating.Market Intelligence & Data Services
Hedge funds, banks, and corporations pay recurring subscription fees for access to financial analytics, company data, and economic insights.Indices (S&P Dow Jones Indices)
Every time a fund tracks an S&P-branded index (like the S&P 500), S&P Global collects licensing fees from ETFs, mutual funds, and structured products.Commodity & Energy Market Data (Platts)
Provides pricing and analytics for oil, natural gas, metals, and more, helping businesses and governments make informed trading and investment decisions.Mobility Revenue
Automotive data, analytics, and intelligence services designed for car manufacturers, suppliers, and financial institutions. This segment was acquired through IHS Markit and focuses on automotive forecasting, vehicle performance tracking, and supply chain insights.
Here’s an example of the process. Simplified.
Credit Ratings – The company needs a credit rating from S&P Global, so they pay a fee to get their bonds rated.
Market Intelligence & Data – Investment firms looking to buy the bond use S&P’s financial data & analytics to assess risk, paying subscription fees.
Indices & Licensing – If the bond is part of an S&P-tracked index, asset managers buying it through ETFs or funds must pay licensing fees.
Commodity & Economic Data (Platts) – Commodity traders use S&P’s Platts data to evaluate the economic outlook before investing in debt markets.
Now that we understand how SPGI generates revenue, let’s dive deeper.
1.2 Revenue Breakdown
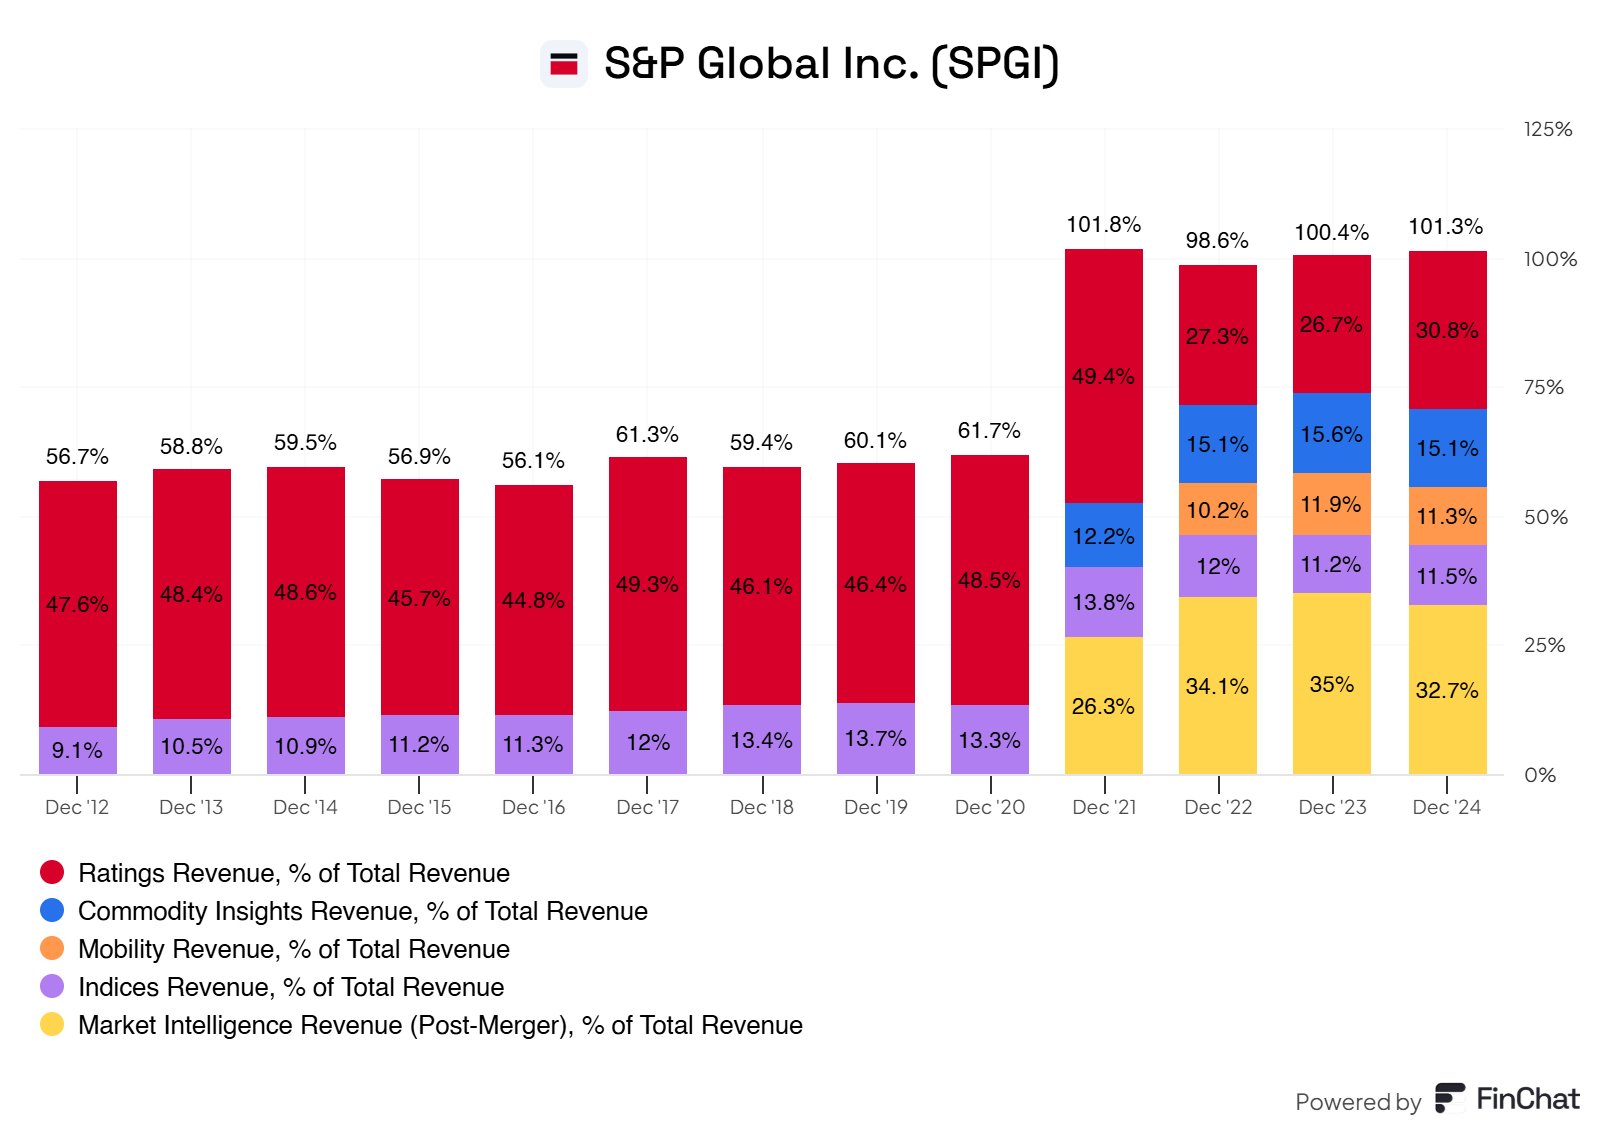
Credit Ratings (accounts for roughly 30.8% of the total revenue)
Market Intelligence & Data Services (accounts for roughly 32.7% of the total revenue)
Indices (S&P Dow Jones Indices) (Accounts for roughly 11.5% of the total revenue)
Commodity & Energy Market Data (Platts) (Accounts for roughly 15.1% of the total revenue)
Mobility Revenue (Accounts for roughly 11.2% of the total revenue)
For those with a keen eye, 2024 shows 101.3%. Revenue is eliminated by 1.3%, bringing the total down to 100% again.
Moreover, we clearly see that S&P Global has a well-diversified portfolio of services and products. All the products and services are complementary to each other, creating more value for both the user and S&P Global.
S&P Global is known for its ratings. While we see clear dominance in its segments, ratings take the cake.
After acquisitions and releasing new offerings—more on that later—we see that S&P Global expanded its offerings in 2021. This made S&P Global an even stronger powerhouse, removing the reliance on its ratings and indices segments and seizing opportunities to generate more revenues, pleasing its portfolio, wallet, and shareholders.
Let’s go over important KPIs for S&P Global.
1.3 KPIs
S&P Global offers different products and services. Some are subscription-based, others are fees, and others are one-time payments.
You might think, "Oké, this makes little sense to me." That's understandable. It did for me as well. But we need to link these types of revenues to the right segments, and suddenly, it makes sense.
Let me try my best to make this as simple as possible.
Subscription Revenue (Red) – Linked to Recurring Data & Analytics
Recurring subscriptions & licensing fees
Customers pay for continuous access to data, indices, and software tools
Example: Hedge funds pay an annual subscription fee for S&P Capital IQ to access real-time stock market data.
Non-Subscription / Transaction Revenue (Blue) – Linked to One-Time Rating Fees
One-time fees per transaction (e.g., per credit rating, per data request)
Higher during periods of debt issuance & M&A activity
Example: A corporate bond issuer pays S&P Global a transaction-based fee for a credit rating before issuing new debt.
Non-Transaction Revenue (Purple) – Linked to Consulting & Custom Solutions
Bespoke consulting & tailored financial solutions
One-time or project-based revenue
Example: An automaker requests a custom market analysis from S&P Global Mobility, generating a one-time fee.
Asset-Linked Fees Revenue (Orange) – Linked to ETFs & Fund-Based Licensing
Revenue scales with assets under management (AUM) linked to indices
SPGI earns a % fee from ETFs, index funds, and structured products tracking its indices
Example: A fund like the SPDR S&P 500 ETF (SPY) pays S&P Global a percentage fee based on the total assets managed in the ETF.
Sales Usage-Based Royalties Revenue (Green) – Linked to Licensing & Data Usage
Fees tied to data usage or API calls
Companies pay based on how often they use S&P’s data feeds
Example: A trading firm licenses real-time oil price data from Platts and pays based on the number of API calls made.
I hope that these KPIs make more sense to you now. Assembling the pieces takes some time and is puzzling, but once you understand them, you know more than the bright pants on Wall Street.
(Fun fact: there are limited Wall Street analysts who go over 10K’s and reports. If you do this, you’re already better informed that the speculators on Wall Street)
Back to the KPIs of S&P Global.
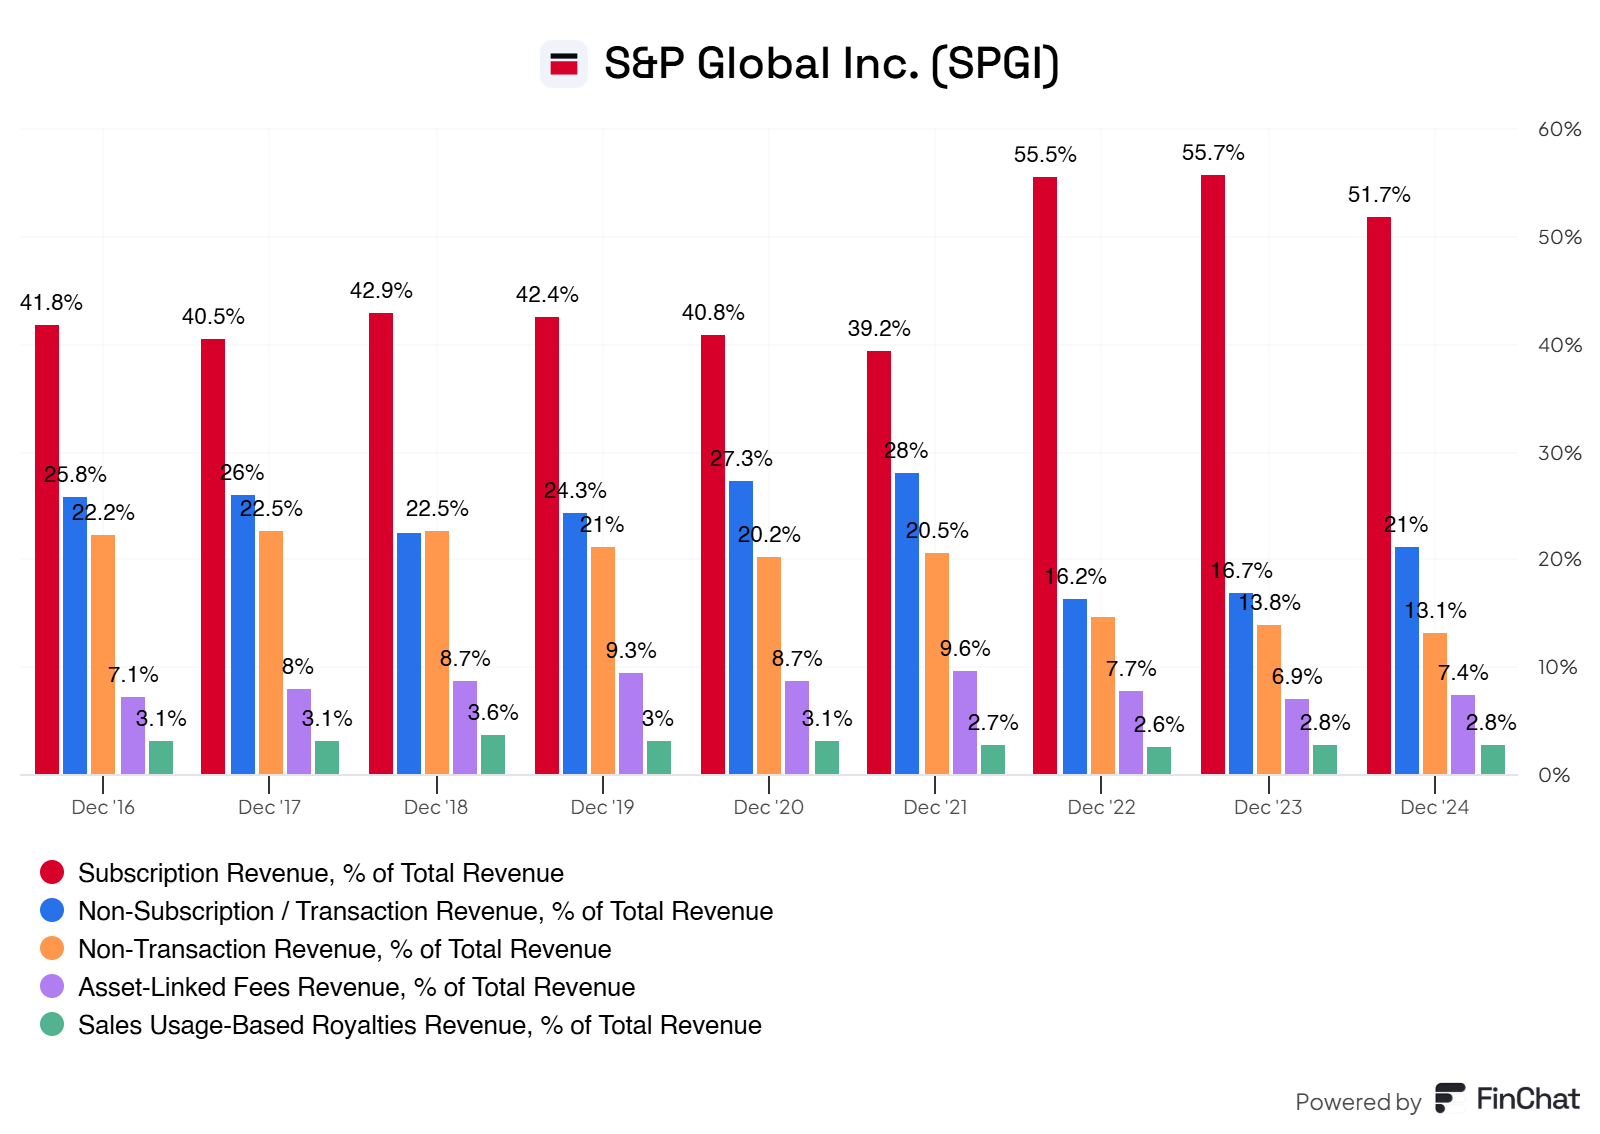
S&P Global subscription revenue has increased from ~40-42% (2016-2020) to over 50%+ (2022-2024). This shift signals higher predictability, stability, and pricing power for SPGI. In 2022 & 2023, subscription revenue surged past 55%, reinforcing a strong recurring revenue model. This reflects the increasing importance of Market Intelligence, ESG, and financial analytics subscriptions.
More predictability.
Stronger pricing power & customer retention.
Increased focus on data analytics & AI-driven insights.
Transacion-based revenue has declined. In 2016-2019, transaction revenue was 22-26% of total revenue. But post-2021, it fell to ~16-21%. This indicates less reliance on volatile, one-time fees (e.g., credit ratings from corporate debt issuances).
Transaction-based fees from S&P Ratings fluctuate based on bond issuance cycles. Companies are shifting toward subscription models for credit risk & market data. Lower transaction revenue means SPGI is diversifying away from rating-dependent income.
Reduced dependency on debt market cycles.
Less revenue volatility in downturns.
Growth in recurring models offsetting cyclical declines.
Asset-linked fees are stable. Passive investing is the tailwind here.
Asset-linked fees (~7-9% of revenue) remain a stable contributor. This comes from ETFs & index funds tracking S&P indices (S&P 500, Dow Jones, etc.). As more money moves into passive investing, SPGI benefits from rising AUM in index-based funds.
S&P-branded indices remain dominant.
Recurring & scalable revenue tied to ETFs.
The passive investing trend is still intact.
Sales usage-based royalties are relatively small but consistent.
Royalties from data licensing & API usage remain ~2.6-3.6% of revenue. SPGI monetizes its financial data & real-time analytics through API integrations.
Expanding AI-driven & machine-learning analytics tools.
Consistent demand for high-quality data feeds.
Let’s summarize our findings, shall we?
✔ Subscription dominance: More than 50% of revenue is now locked-in, predictable, and recurring.
✔ Less transaction volatility: Revenue is less tied to bond issuance cycles.
✔ Index & asset-linked revenue stability: Passive investing fuels steady fees.
✔ API & data licensing expansion: Digital transformation & AI-driven tools create new monetization streams.
SPGI has successfully shifted to a more resilient business model, making it a strong compounder with predictable earnings growth.
2. Executive Leadership
2.1 CEO Experience
Martina L. Cheung is President, CEO, and a member of the Board of Directors of S&P Global.
Previously, Ms. Cheung was President of S&P Global Ratings and served as the Executive Lead of S&P Global Sustainable1. Earlier, she was President of S&P Global Market Intelligence.
Ms. Cheung joined the Company in 2010 as Vice President of Operations for S&P Global Ratings and went on to serve as S&P Global’s Chief Strategy Officer. She also was Head of Risk Services for S&P Global Market Intelligence.
Prior to joining S&P Global, Ms. Cheung worked for Accenture’s Financial Services Strategy group and later as a Partner at Mitchell Madison Consulting.
Ms. Cheung was named one of the Most Powerful Women in Finance by American Banker and included on the list of Influential Women in Institutional Investing by Pensions & Investments in 2024. Also, in 2024, INvolve named her to its 100 Empower Executives list for the second consecutive year. Ms. Cheung received the Merit Award from The Women's Bond Club in 2022. In addition, she was honored at the 2022 Ascend A-List Awards for advancing Pan-Asian professionals, and she was inducted into the Academy of Women Leaders by the YWCA New York City in 2016.
Ms. Cheung is a member of the Council on Foreign Relations, the Economic Club of New York, and served on the U.S. Commodity Futures Trading Commission’s (CFTC) subcommittee on Climate-Related Market Risk.
Ms. Cheung serves on the Board of Trustees for Catholic Charities New York and was a member of the Board of CRISIL, a global analytics company and India’s leading credit ratings agency.
She holds a bachelor’s degree in commerce and a master’s degree in business studies from National University of Ireland, Galway.

2.2 Employee Satisfaction Ratings
On LinkedIn the scores from employees in regards to S&P Global is interesting!
Te reviews from (ex) employees are quite good to say the least. Let us go over some of them,
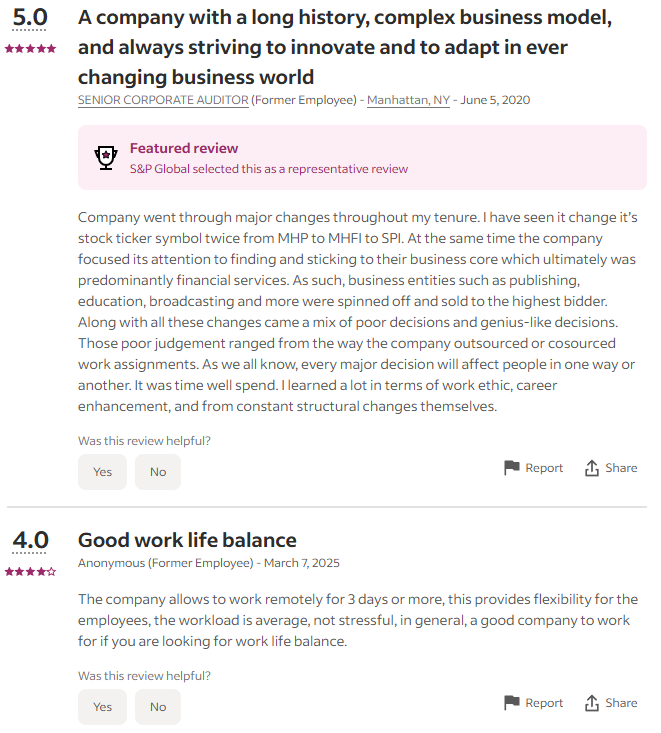


Of course, there are some reviews that indicate that there’s loads wrong with the business. But, primarily, the reviews are excellent.
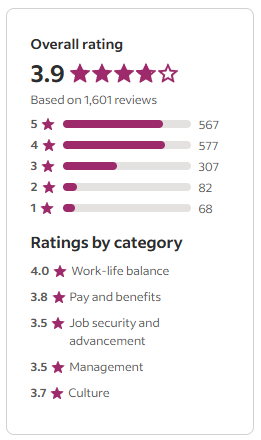
According to 1.601 reviews, S&P Global scores well in the following categories:
Work-life balance
Pay and benefits
Job security and advancements
Management
Culture
These are very strong indicators of satisfied employees.
A good work-life balance ensures employees are less stressed and have enough free time to relax before another hard work day. This, in turn, drives down the number of sick hours employees have. Having a good balance is correlated with fewer sick leaves for employees.
Good pay and benefits positively motivate employees to stay at the business and put in the work. Less rotation in employees means that there are more employees who’ve been around for an extended period of time and know what to do and how to do it well, which usually helps push the business in the right direction. Do not be fooled. Every role within a business is crucial to its operations. From the janitor to the helpdesk employee, much is needed to ensure the success of S&P Global.
Moreover, a good culture and employees who are satisfied with management are also crucial to the success of any company. Employees seem extremely satisfied with the company.
Management, culture, and employees seem aligned.
ba da ba ba baaaa, I’m loving it.
2.3 CEO Value Creation
Is management creating value for the company and for shareholders?
Here, we can check off ‘‘yes’’ for value creation for the company and the shareholders.
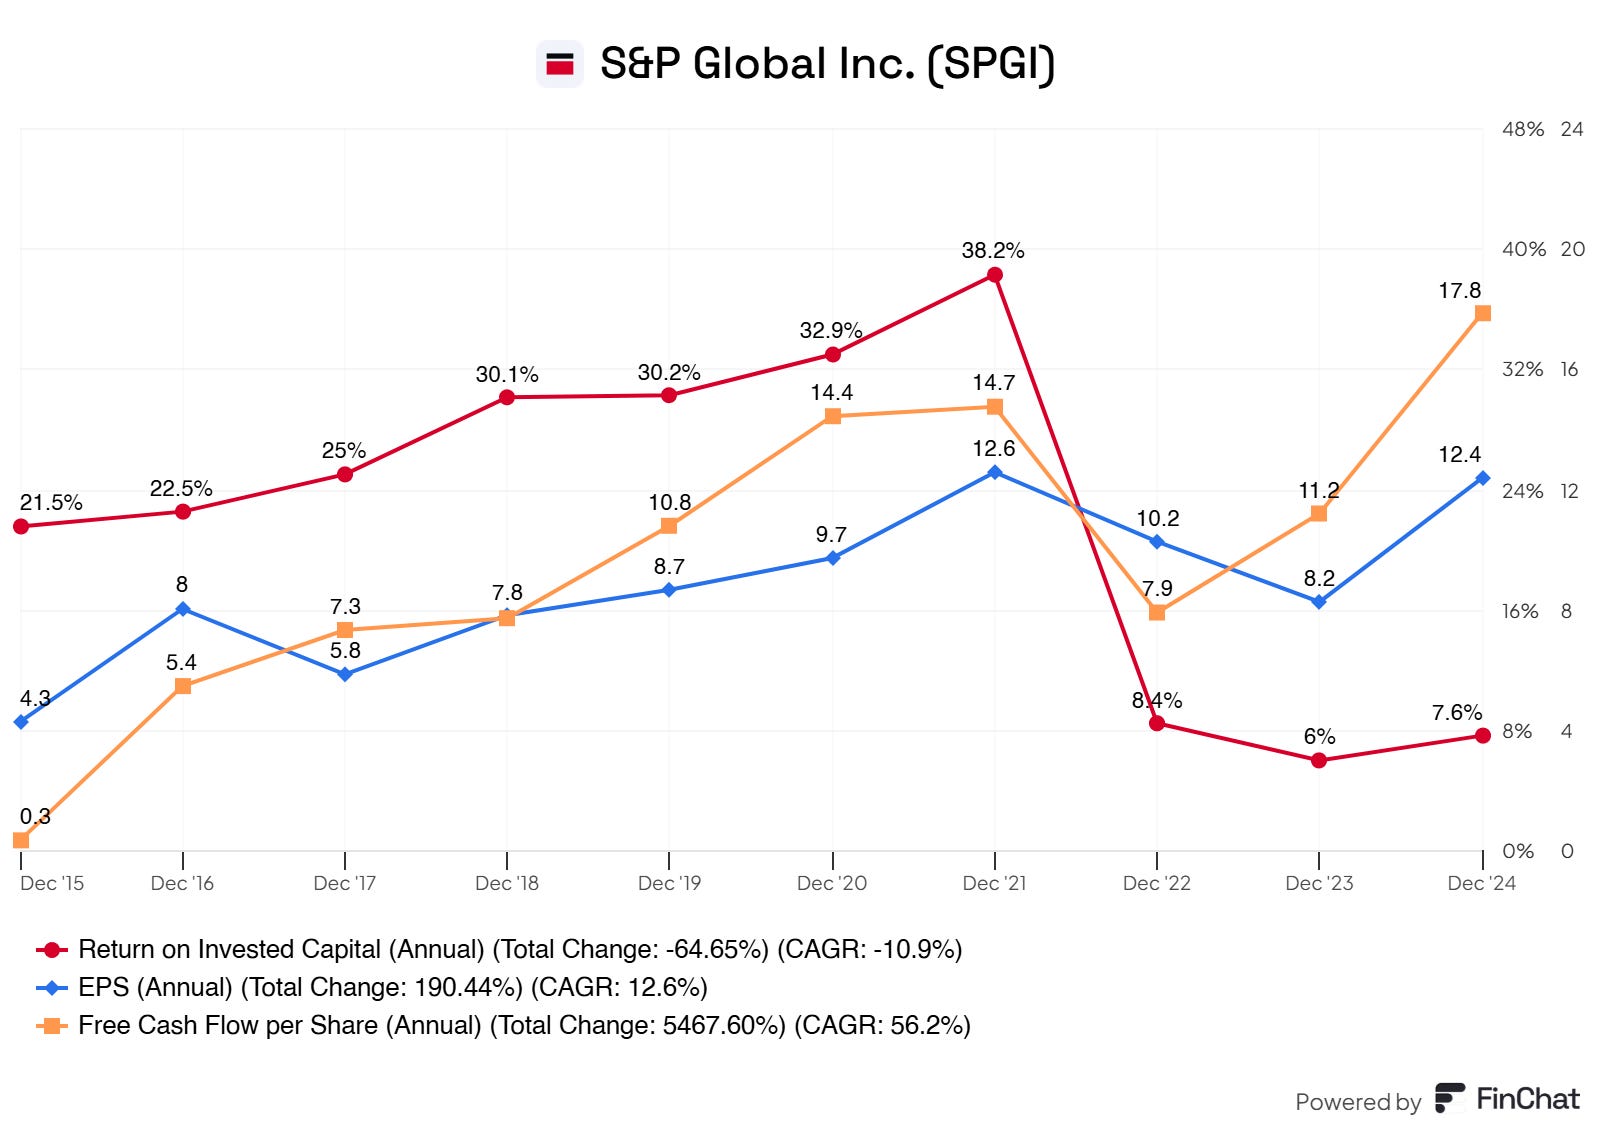
Excellent overall growth in the FCF per share, EPS, and ROIC.
Yes, you’re right. The ROIC is below what we strive for, 20%.
SPGI significantly increased its invested capital in 2022 after acquiring IHS Markit for $44 billion. This inflated the denominator in the ROIC formula because goodwill and intangible assets from acquisitions increased.
3. Insider and institutional ownership
Would you trust a baker who made your cake but wouldn’t dare to take a bit himself?
No, I wouldn’t either. Because then there must be something wrong with the cake, its ingredients, or how it is made, right?
Implement this with a company and management.
‘‘It’s more complicated than your analogy.’’
You’re right, it is. But we would love to see significant inside ownership or insiders buying more stock. It’s not a dealbreaker if it doesn't happen, but it would add that cherry to the cake. ;-)

Insiders hold 329.9 K shares, or 0.10%, of the company's total, amounting to 170.5M.
The most insider shares are held by:
Douglas Peterson (Special Advisor & Director): 168.0K
Adam J. Kansler (Former President of S&P Global Market Intelligence, Inc.): 34.1K
Edouard Tavernier (President of S&P Global Mobility): 18.9K
Martina L. Cheung (President, CEO & Director): 17.2K
The CEO barely made it in our top 5, pfoeh.
So, there’s no significant inside ownership, unfortunately.
But are the insiders buying more, perhaps?

Yikes.. they’re not buying either.
Alright, there’s limited inside ownership and insiders are not buying (yet). Good to know, we move on.
Again, this is not a dealbreaker, but we keep this in the back of our minds.
4. Competitive and Sustainable Advantage (MOAT)
So, a MOAT can be in either one or more of the following forms:
Brand Power
Patents
Scale and Cost Advantages
Switching Costs
Network Effect
Attracting Talent (I consider this a MOAT, others don’t. Decide for yourself)
Brand Power
S&P Global is a gold standard in financial intelligence. Banks, governments, hedge funds, and corporations worldwide trust its credit ratings, indices, and data analytics.
S&P Ratings is a critical component of global finance – it helps price corporate bonds, sovereign debt, and structured finance.
S&P 500 Index is the benchmark for global equities, influencing trillions of dollars in passive and active investments.
Platts (commodity insights) is a leading price benchmark for oil, gas, and metals, essential for traders and energy companies.
Deep trust & credibility – regulators, investors, and institutions rely on SPGI’s methodologies.
Competitive edge over newer players – SPGI has built authority that new entrants cannot replicate easily.
Pricing power – clients pay premium fees because they can’t afford to use lower-tier data.
Scale and Cost Advantages
SPGI operates at a scale that few competitors can match. Its ability to aggregate and process massive amounts of financial data gives it a huge cost advantage.
Massive fixed costs are already sunk, meaning each new customer has a low marginal cost.
Global reach – SPGI serves every major financial market worldwide, allowing it to spread costs over a vast customer base.
AI & Machine Learning Optimization – The more data SPGI collects, the better its predictive analytics become, reinforcing its cost advantage.
Low-cost operations & high-profit margins due to economies of scale.
Competitors struggle to replicate the same depth and breadth of coverage.
SPGI can reinvest heavily into AI & data analytics, keeping its moat strong.
Switching Costs
Once a bank, investor, or corporation integrates S&P’s ratings, data, or indices into their models, switching to a competitor is extremely costly and impractical.
Regulatory Dependence: Financial institutions and governments must use SPGI ratings for debt issuance and compliance.
Investment Funds & ETFs are deeply tied to S&P Indices, meaning billions in assets can’t simply switch benchmarks without massive tax and structural implications.
Enterprise Data Integration: Hedge funds, insurers, and banks build their entire financial models on SPGI data – switching would require a complete system overhaul.
Predictable, recurring revenue – customers rarely cancel SPGI subscriptions.
Pricing power – clients pay premium fees because it’s too disruptive to switch.
High retention rates – most SPGI clients stay for decades.
Network Effect
SPGI benefits from a self-reinforcing network effect – the more companies and investors that rely on its data, the stronger its competitive position becomes.
S&P 500 & S&P Dow Jones Indices dominate passive investing, influencing trillions of dollars in ETF and mutual fund assets.
Credit Ratings are widely used across the global bond market – investors, banks, and governments all use SPGI ratings to gauge creditworthiness.
Commodity markets reference Platts pricing, reinforcing its position as an essential benchmark for energy trading.
Once SPGI dominates a segment, it becomes nearly impossible to displace.
Competitors struggle to gain traction because everyone already uses SPGI data.
Its data becomes more valuable over time, as financial markets standardize around it.
Why it’s nearly impossible to disrupt:
Regulatory entrenchment: Governments, banks, and institutions must use SPGI’s data & ratings.
Pricing power & recurring revenue: High switching costs lock in customers for decades.
Passive investing boom: Index-linked revenue will keep growing as money flows into ETFs.
AI & data analytics expansion: SPGI is investing heavily in machine learning & financial automation, reinforcing its competitive edge.
5. Industry Analysis
5.1 Industry Growth Prospects
Industry Growth Analysis: Financial Data and Analytics Outlook
1. Industry Overview and Market Size
The financial data and analytics industry provides critical intelligence—credit ratings, market benchmarks, commodity insights, mobility data, and workflow solutions—to capital markets, commodity markets, and automotive sectors. Key players include S&P Global, Moody’s, MSCI, Bloomberg, and emerging fintechs. The industry’s total addressable market is estimated at $50–60 billion in 2025, spanning:
Credit Ratings: $5–6 billion, dominated by S&P Global and Moody’s (~80% share).
Financial Analytics: $13–15 billion in 2024, projected to reach $19.8 billion by 2028 (MarketsandMarkets).
Indices and Benchmarks: $10–12 billion, tied to passive investing growth.
Commodity and Mobility Data: $15–20 billion, expanding with energy transition and automotive digitization.
This market is poised for sustained expansion, driven by increasing reliance on data-driven decision-making across global financial ecosystems.
2. Industry Growth Rate
The financial data and analytics industry is forecasted to grow at a compound annual growth rate (CAGR) of 11–12% from 2023 to 2028, accelerating from a historical 8–10% CAGR (2018–2023). Key sub-segment projections include:
Credit Ratings: 5–7% CAGR through 2027, fueled by a $2 trillion+ "debt maturity wall" (2025–2027) as corporates refinance maturing debt.
Financial Analytics: 11–12% CAGR, per MarketsandMarkets, driven by digitization and regulatory complexity.
Indices: 10–15% CAGR, tied to passive investing and ETF AUM growth (projected to exceed $15 trillion globally by 2030, up from $11 trillion in 2024).
Commodity Insights: 8–10% CAGR, spurred by energy transition and volatile commodity markets.
Mobility Data: 10–12% CAGR, linked to automotive electrification and supply chain analytics.
By 2030, the industry could approach $80–100 billion, reflecting compounding demand for actionable insights in an increasingly complex global economy.
3. Key Trends Shaping the Industry Outlook
The following trends, informed by market dynamics and reinforced by S&P Global’s 2024 commentary, will drive industry growth through 2030:
Debt Issuance and Regulatory Entrenchment
Outlook: The $2 trillion+ debt maturity wall (2025–2027) will boost demand for credit ratings as issuers refinance at higher rates amid persistent inflation (U.S. CPI ~3% in 2025 forecasts). Regulatory frameworks (e.g., Basel III, SEC mandates) cement ratings as a prerequisite for capital market access, ensuring steady growth.
Impact: Credit ratings revenue could grow 5–7% annually, with peaks in 2025–2026 as issuance surges. Emerging markets (e.g., Asia-Pacific) will contribute as debt markets deepen.
Rise of Passive Investing
Outlook: Passive funds now exceed 50% of U.S. equity fund AUM (up from 30% a decade ago), with global ETF AUM projected to hit $18 trillion by 2028 (BlackRock estimates). Benchmarks like the S&P 500 drive recurring asset-linked fees, a high-margin, sticky revenue stream.
Impact: The indices segment could see 10–15% CAGR, with growth accelerating in Europe and Asia as passive adoption rises (e.g., European ETF AUM up 20% annually).
Digitization and Data Proliferation
Outlook: Financial institutions are doubling down on proprietary data for risk management, compliance, and investment strategies. Subscription-based revenue models (e.g., market intelligence, commodity data) are expanding as cloud adoption and real-time analytics become standard. Private market data and alternative datasets (e.g., satellite imagery, ESG metrics) are high-growth niches.
Impact: Subscription revenue could grow 8–12% annually, with a 15–20% CAGR in private markets and ESG data through 2030.
ESG and Energy Transition
Outlook: ESG data demand is surging, with a projected CAGR of 20–25% through 2030 (McKinsey), as investors allocate $50 trillion+ to sustainable assets by decade-end (BloombergNEF). Energy transition analytics (e.g., carbon pricing and renewable supply chains) are critical amid net-zero commitments.
Impact: ESG-focused products could add $5–10 billion to the industry by 2030, with commodity insights growing 8–10% annually as oil/gas pivots to renewables.
AI and Technological Disruption
Outlook: AI adoption (e.g., generative AI, machine learning) transforms data processing, predictive analytics, and workflow automation. Incumbents integrating AI (like S&P Global’s Kensho) will maintain an edge, while fintechs challenge with niche solutions.
Impact: Technology-driven efficiency could boost margins 200–300 basis points by 2030, with AI-related revenue streams growing at 15–20% CAGR.
4. Regional Growth Dynamics
North America: 50%+ of current market share; 10–11% CAGR, driven by U.S. debt markets and passive investing.
Europe: 25% share; 12–14% CAGR, with ESG regulations (e.g., EU Taxonomy) and index growth leading.
Asia-Pacific: 15% share; 15–18% CAGR, fueled by emerging debt markets (e.g., China, India) and commodity demand.
Rest of World: 10% share; 10–12% CAGR, with Latin America and Middle East energy transitions notable.
5. Competitive Landscape and Industry Evolution
Incumbents: S&P Global and Moody’s dominate ratings (80% share), while MSCI and Bloomberg lead in indices and analytics. Their scale, proprietary data, and high switching costs ensure resilience.
Challengers: Fintechs (e.g., FactSet, Refinitiv) and AI startups target niche segments (e.g., alternative data), but lack the breadth to displace leaders.
Consolidation: M&A activity (e.g., S&P’s IHS Markit deal) will continue, with $5–10 billion in annual deals through 2030, expanding capabilities in ESG, mobility, and AI.
Innovation Race: AI and ESG integration will differentiate winners, with 20–30% of industry revenue potentially tied to new products by 2030.
6. Risks to Industry Growth
Economic Downturn: A 2025–2026 recession (e.g., GDP growth <2% in G7) could slow debt issuance and ETF inflows, trimming growth by 1–2%.
Regulatory Shifts: Changes to rating mandates or data privacy laws (e.g., GDPR expansions) could disrupt 5–10% of revenue streams.
Tech Disruption: AI-driven competitors could erode margins in commoditized data segments if incumbents lag in innovation.
7. Industry Outlook (2025–2030)
The financial data and analytics industry is on a robust growth path, with a projected market size of $80–100 billion by 2030 (11–12% CAGR). Key drivers—debt refinancing, passive investing, digitization, ESG, and AI—align with global economic and regulatory trends. By 2027, the industry could hit $70–75 billion, with 2025–2026 as pivotal years due to the debt maturity wall and ESG adoption. S&P Global’s 5–7% revenue growth guidance for 2025 (implying $14.9–$15.2 billion) reflects this trajectory, though industry-wide growth could outpace individual players as new entrants and niches emerge.
2025 Projection: $55–60 billion market, 10–11% growth, led by ratings and indices.
2030 Vision: $80–100 billion market, with ESG and AI contributing 20–25% of revenue, and Asia-Pacific nearing 20% share.
5.2 Competitive Landscape

I identify the following as peers or competitors of &P Global
London Stock Exchange Group plc
Verisk Analytics, Inc.
FactSet Research Systems Inc.
MSCI Inc.
Moody’s Corporation
Where S&P Global Excels
5-Year Revenue CAGR (16.2%)
Comparison: S&P Global leads with a 16.2% 5-year revenue CAGR, surpassing MSCI (12.9%), FactSet (9.0%), Moody’s (8.0%), Verisk (2.0%), and significantly outpacing LSEG (30.8%, though this reflects broader exchange growth post-Refinitiv acquisition).
Strength: This reflects S&P’s diversified portfolio (Ratings, Indices, Market Intelligence, Commodity Insights, Mobility) and the successful 2022 IHS Markit merger, which boosted revenue streams. It indicates robust top-line growth, particularly in indices and ratings.
Free Cash Flow Margin (39.2%)
Comparison: S&P Global’s 39.2% free cash flow margin is strong, trailing only MSCI (51.4%) and slightly ahead of LSEG (37.5%), Moody’s (35.6%), Verisk (31.9%), and FactSet (24.1%).
Strength: High cash flow generation supports reinvestment, dividends ($1.1 billion in 2024), and share repurchases ($3.3 billion in 2024), enhancing shareholder value. This aligns with the industry’s recurring revenue model.
Gross Profit Margin (69.1%)
Comparison: S&P’s 69.1% gross profit margin is competitive, exceeding FactSet (54.3%) and Verisk (66.7%), though below LSEG (86.9%), MSCI (82.0%), and Moody’s (72.6%).
Strength: Reflects efficient cost management and high-margin segments (e.g., Ratings, Indices), bolstered by proprietary data and low variable costs.
Operating Margin (40.8%)
Comparison: S&P’s 40.8% operating margin is solid, surpassing LSEG (20.9%) and FactSet (32.0%), and close to Moody’s (42.1%) and Verisk (43.8%), though below MSCI (53.7%).
Strength: Indicates strong operational efficiency, supported by scale and diversification, though it lags behind MSCI’s higher-margin indices focus.
Where S&P Global Lags
Return on Invested Capital (ROIC) (7.3%)
Comparison: S&P’s 7.3% ROIC is the lowest among peers, significantly trailing MSCI (26.9%), Verisk (22.7%), Moody’s (17.9%), FactSet (16.5%), and LSEG (0.2%, skewed by exchange operations).
Weakness: Suggests less efficient capital allocation, potentially due to heavy investments in acquisitions (e.g., IHS Markit) and goodwill ($51.473 billion). This could indicate over-leverage or slower returns on recent expansions.
Return on Capital Employed (ROCE) (9.9%)
Comparison: S&P’s 9.9% ROCE is the weakest, far behind MSCI (39.1%), Verisk (36.2%), Moody’s (23.7%), FactSet (20.6%), and LSEG (5.1%).
Weakness: Reflects lower efficiency in utilizing total capital (debt + equity), possibly due to high debt ($11.398 billion) and intangible assets from mergers, reducing overall returns compared to peers with leaner balance sheets.
5-Year Diluted EPS CAGR (7.5%)
Comparison: S&P’s 7.5% diluted EPS CAGR is modest, lagging MSCI (16.3%), Verisk (20.0%), FactSet (8.4%), and Moody’s (8.7%), with LSEG at 1.4% due to acquisition dilution.
Weakness: Indicates slower earnings growth per share, potentially due to share dilution from acquisitions or higher tax impacts, despite strong revenue growth. This contrasts with peers’ focus on earnings efficiency.
Operating Margin (40.8%) vs. MSCI (53.7%)
Comparison: While competitive, S&P’s operating margin trails MSCI’s 53.7%, reflecting MSCI’s higher profitability in indices and analytics.
Weakness: Suggests S&P’s broader diversification (e.g., Mobility, Commodity Insights) may dilute margins compared to MSCI’s focused, high-margin business model.
Segment-Specific Context:
Ratings: S&P and Moody’s are neck-and-neck, with similar margins, but S&P’s diversification gives it an edge in growth.
Indices: MSCI outpaces S&P in margins and returns, leveraging a narrower, high-margin focus.
Market Intelligence: FactSet and S&P compete closely, but S&P’s scale gives it an advantage, though FactSet’s higher ROIC suggests better capital efficiency.
Mobility: Verisk’s strong ROIC and EPS growth highlight its efficiency in this niche, challenging S&P post-IHS Markit.
Commodity Insights: LSEG’s broad data reach competes, but S&P’s integration of IHS Markit data strengthens its position.
S&P Global excels in revenue growth (16.2% 5Y CAGR) and maintains strong cash flow (39.2%) and gross profit margins (69.1%), reflecting its diversified portfolio and market leadership. However, it lags in capital efficiency (ROIC 7.3%, ROCE 9.9%) and diluted EPS growth (7.5%), trailing MSCI’s profitability and Verisk’s earnings momentum. To maintain its competitive edge, S&P should focus on optimizing capital allocation—potentially through divestitures or cost synergies from IHS Markit—and enhancing EPS growth, possibly via share buybacks or margin improvement. Compared to peers, S&P is a growth leader but needs to address efficiency to match the profitability of MSCI or the capital returns of Verisk.
Now, let’s get to the best parts of this investment case!
For free readers, this is where it ends.
Want the full investment case? Join us for €30/month or €324/yearly (save 10%).
Believe me—with these insights and potential opportunities, you'll make that back in no time.
A no-brainer.