
Meta Platforms: $145B in Capex Scared the Market. It Shouldn't Have.
Why 33% revenue growth, $145B in capex, and 3.56 billion daily users still don't tell the full story.

Most people still think of Meta as a social media company that got lucky with advertising.
The company that made you post holiday photos and showed you ads for things you already bought. That mental model is going to cost investors money over the next five years, because what Meta is today is something genuinely different. And if you own it, are thinking about owning it, or have written it off entirely, you need to understand what is actually happening inside this business right now.
What the business actually looks like
Start with the headline numbers, because they are not subtle.
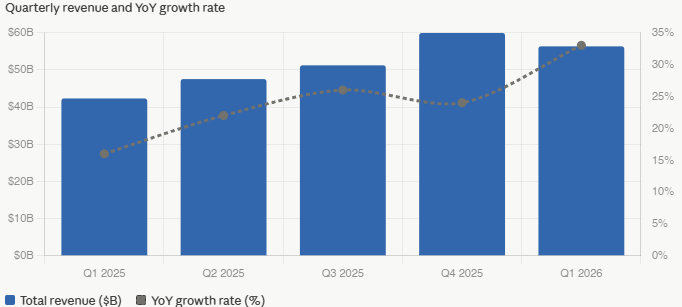
Q1 2026 revenue came in at $56.3 billion, up 33% year-over-year. That is not the growth rate of a mature advertising platform coasting on its installed base. That is the growth rate of a business where something structural is changing in its favor. More than 3.56 billion people used at least one of Meta’s apps every day in March 2026. Facebook, Instagram, WhatsApp, and Threads together form the largest daily active user base of any company on earth. Operating income was $22.9 billion on that revenue. That is a 41% operating margin, higher than most pharmaceutical companies, most software businesses, and almost every other advertising platform in existence.
Q1 free cash flow was $12.4 billion. The company ended the quarter with $81.2 billion in cash and marketable securities against $58.7 billion in debt.
What drove the revenue growth? Two things working together simultaneously: more engagement, meaning more time people spend on the apps, and better monetization of that engagement, meaning each ad is performing better for the businesses buying them. Both drivers are accelerating at the same time, and the reason for that acceleration is AI.
The advertising machine nobody is talking about
Meta has spent the past two years systematically rebuilding its advertising technology from scratch. The old system was a collection of hundreds of individual models, each optimized for a specific objective or surface. Facebook feed ads had their own model. Instagram Reels had a different one. Lead generation campaigns had another. The new system consolidates all of this into a small number of large, unified models that generalize learning across every surface and objective simultaneously.
The model at the center of this is GEM, the Generative Ads Recommendation model. Trained on thousands of GPUs using an architecture that is twice as efficient at improving ad performance for a given amount of compute. When Meta doubled the GPU cluster used to train GEM, it got better. When it added organic engagement signals and Instagram data, it got better again. It drove a more than 6% increase in conversion rates for landing page view ads in a single quarter.
There is also Andromeda, which handles ad retrieval, selecting the most relevant candidates from tens of millions of potential ads. There is Lattice, the unified model architecture that has already cut the number of separate ad models by approximately 100 and is consolidating another 200 over the coming years. There is the adaptive ranking model, which routes ad requests to more compute-intensive inference models when the conversion probability is high.
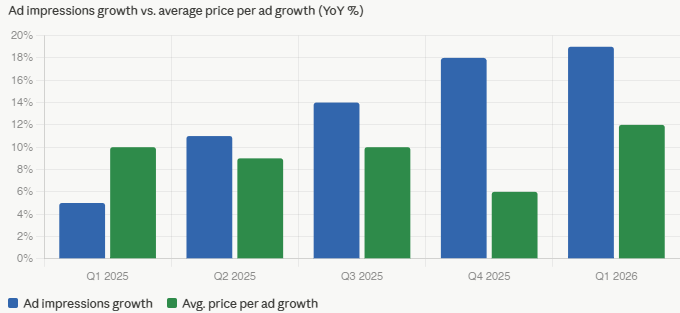
The result: advertiser conversion rates are growing faster than impressions. Each impression is generating more value for the business buying it. When that happens, businesses spend more, and revenue grows faster than user growth. The value optimization suite crossed $20 billion in annual run rate in Q1 2026, more than doubling year-over-year. Partnership ads crossed $10 billion in annual run rate. More than 8 million advertisers are now using at least one of Meta’s generative AI ad creative tools.
This is not a one-quarter story. Meta has been investing in this stack since 2023, and the improvements compound. Each new model architecture makes the previous one look primitive. There is substantial headroom remaining in the roadmap.
“The annual run rate going through our completely end-to-end AI-powered ad tools has passed $60 billion.” — Mark Zuckerberg
The recommendation engine revolution
The advertising story and the engagement story are the same story. Better content recommendations drive more time on the apps, more time drives more ad impressions, and more impressions trained on better data produce better advertiser performance. You cannot separate them.
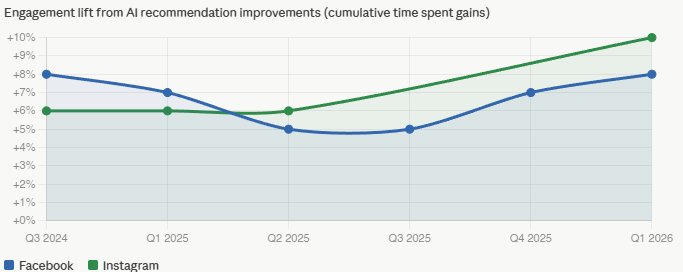
In Q1 2025, improvements to Meta’s recommendation systems drove a 7% increase in time spent on Facebook and a 6% increase on Instagram. By Q1 2026, Instagram Reels saw a 10% lift from ranking improvements made in a single quarter. Facebook video time grew more than 8% globally, the largest quarterly gain in four years. More than half a billion users on each platform are now watching AI-translated videos weekly, content that would not have been visible to them before the translation infrastructure existed.
The technical changes behind these improvements matter. Meta doubled the length of user interaction sequences used for training on Instagram, meaning its models now look at a longer history of what each person has engaged with. It increased the richness of how each interaction is described. It sped up how quickly new posts are indexed, so content published today appears in feeds today. Same-day posts now represent more than 30% of recommended Reels on both platforms, more than double the level of a year ago.
The ambition is not just better recommendations for what exists today. It is a fundamentally new infrastructure that understands what each person is trying to accomplish and shows them content that helps them do it. When that lands at the scale Meta operates, the engagement and revenue implications are very large.
The capex number that changes everything
Meta is spending between $125 billion and $145 billion in capital expenditure in 2026 alone, revised upward from the already staggering $115 to $135 billion guided at the start of the year. That is more than most countries spend on their entire defense budgets annually.
What is it going toward? Data centers, servers, networking infrastructure, and the energy systems to power all of it. Meta is building multiple multi-gigawatt compute clusters. Prometheus, coming online in 2026, is designed to be the world’s first gigawatt-plus cluster. Hyperion is designed to scale to 5 gigawatts over several years. There are additional Titan clusters in development.
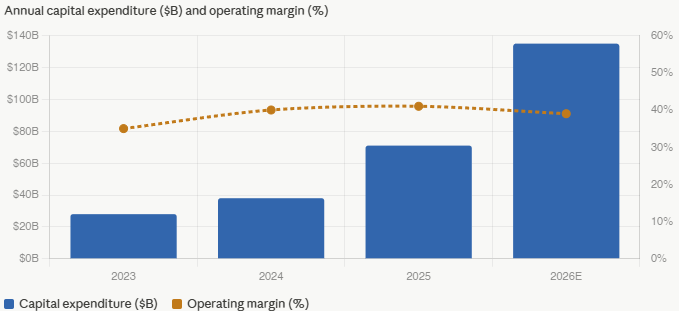
Why so much? Every time Meta has built what it thought was an aggressive amount of compute, it has found profitable ways to use more than it built. The core advertising and recommendations business can absorb enormous amounts of additional compute and generate measurable returns on every dollar. The constraint has never been ideas for how to use computing. It has been the supply of it.
“Our experience so far has been that we have continued to underestimate our compute needs, even as we have been ramping capacity significantly as the advances in AI have continued.” — Susan Li, CFO
The company ended Q1 with $107 billion in incremental contractual commitments driven by multi-year cloud deals and infrastructure purchase agreements. The capital intensity is real and matters for valuation. But the returns on prior compute investments, visible in the advertising performance data and engagement numbers, suggest this is infrastructure with a demonstrated track record of generating profitable returns rather than a speculative bet.
Meta Superintelligence Labs: the bet behind the bet
In mid-2025, Zuckerberg established Meta Superintelligence Labs, a separate research organization within Meta focused exclusively on frontier AI models. Alexander Wang leads the overall effort. Nat Friedman leads AI products and applied research. Shengjia Zhao is the chief scientist. The team has been described as the highest-talent-density research effort in the industry, a claim that appears to be taken seriously, given the caliber of people who have joined.
The first output was the Muse family of models, with Muse Spark released in Q1 2026. Spark is a world-class model that makes Meta AI a leading assistant in categories including visual understanding, health, shopping, social content, and local information. It drove double-digit percentage increases in Meta AI sessions per user following the broad rollout.
Spark is one step on a scaling ladder. More advanced models are already in training. The lab is climbing, and Spark is the first rung visible to the public.
Meta AI is now available in over 200 markets with more than a billion monthly active users. The standalone Meta AI app has consistently ranked near the top of the app stores since launch. Weekly conversations with business AIs grew 10x in the first quarter of 2026 alone. The scale of distribution Meta has to deliver frontier AI models to end users is something no other AI company possesses. When the models are leading, the distribution advantage is enormous.
“People will be more important in the future, not less. Meta believes in empowering individuals, and those are the kinds of products that we’re going to build — and I believe they’re going to be some of the most important and valuable products of all time.” — Mark Zuckerberg
The AI glasses nobody expected to work
Ray-Ban Meta AI glasses deserve their own section because the traction is surprising enough that most investors have not updated their mental model to account for it.
Sales more than tripled in 2024. Ray-Ban Meta Optics, designed for all-day wear, launched in Q1 2026. Display glasses with the Meta Neural Band sold out in almost every store within 48 hours of launch. The number of people using Meta AI on the glasses daily continues to grow.
The strategic logic is that glasses are the ideal form factor for AI. An assistant that can see what you see, hear what you hear, and talk to you throughout the day can do things a phone-based assistant fundamentally cannot. Real-time information about what is in front of you. Live translation of conversations. Information overlaid on your physical environment. Eventually, with a full holographic display, entirely new visual experiences will be generated in your field of vision.
More than a billion people worldwide wear glasses for vision correction. If even a fraction of that base transitions to AI glasses over the next decade, the category becomes one of the largest consumer electronics markets in history. Meta is years ahead of any competitor.
The headwinds you need to know
No honest assessment of Meta leaves out the headwinds.
Europe is a real risk. European advertising revenue was approximately 16% of the worldwide total in 2024. The European Commission’s Digital Markets Act requirements could materially worsen the European business environment, and the ongoing legal proceedings add uncertainty about timing and magnitude.
Youth litigation is unquantified but flagged as material. Multiple US trials are scheduled in 2026. The language used in filings signals meaningful exposure even though specific amounts have not been disclosed.
Near-term earnings pressure is real. Full-year 2026 total expenses are guided at $162 to $169 billion. Depreciation from the capex build flows through operating expenses for multiple years. Operating income will grow in absolute terms, but its growth rate will lag revenue growth as the investment cycle peaks.
Trade policy is a structural risk. Asia-based e-commerce advertisers account for a meaningful share of revenue. The de minimis exemption change for Chinese imports already reduced spending from that cohort in 2025. Diversification across millions of advertisers provides a cushion but does not eliminate the exposure.
The AI investment requires trust in future monetization. Meta AI, with a billion monthly active users, is not yet a direct contributor to earnings. The $125 to $145 billion in capex is largely being spent in anticipation of revenue opportunities that do not yet show up on the income statement. That is the best.
Valuation and trajectory
Here is what makes the current setup genuinely interesting.
Meta is generating $125 billion in trailing twelve-month operating cash flow, growing revenue at 33%, and running 41% operating margins. Those are the numbers of a business compounding at an extraordinary rate. Yet the valuation multiples tell a different story, and understanding why requires looking at three metrics together rather than any one in isolation.

Forward EV/EBIT currently sits at 17.08x against a ten-year median of 18.43x. That compression is real, and the mechanism is straightforward. The $135 billion capex midpoint for 2026 generates an enormous depreciation charge that flows directly through to EBIT. Depreciation is a non-cash expense, but it hits operating income in full, making reported profitability look worse than the underlying cash generation of the business.
What the EV/EBIT chart is showing you is not a broken business. It is a business whose reported earnings are temporarily suppressed by the accounting treatment of an unprecedented infrastructure investment. Q1 2026 operating income was $22.9 billion, annualized to approximately $91.6 billion in forward EBIT. The core franchise is not being valued as broken. It is being valued as pressured, which is a different and more temporary condition.
Forward P/OCF sits at 11.09x against a ten-year median of 15.01x. This compression is more dramatic, and the explanation is more nuanced than it first appears.
Because depreciation is a non-cash charge, it is added back in the cash flow statement. OCF, therefore, holds up considerably better than EBIT through a heavy investment cycle. Meta’s LTM OCF of $125 billion reflects this. The business remains extraordinarily cash-generative at the operational level, regardless of how depreciation affects reported earnings.
So why is the P/OCF multiple so compressed? The market is not ignoring Meta’s operating cash flow generation. It is discounting the proportion of that cash flow currently converting into free cash flow because of the extraordinary scale of the AI infrastructure buildout. That is the honest mechanism, and it is an important distinction.
When capex runs at $135 billion against $125 billion in OCF, free cash flow conversion deteriorates sharply. Investors correctly recognize that OCF is not currently translating into distributable cash at historical rates. The market is effectively saying it will not apply a historical multiple to an OCF stream that must be almost entirely reinvested. That is a rational response to the current FCF yield environment, and it explains the gap between the P/OCF multiple today and the long-run median.
Meta’s valuation discount reflects skepticism around the durability of free cash flow conversion during the AI infrastructure cycle, not deterioration in the underlying earnings engine. The market is treating elevated capex as structurally permanent. If capex intensity normalizes relative to revenue growth over time, current valuation multiples likely understate normalized cash generation power materially.
The fair value case
My fair value range of $720 to $760 per share does not require a heroic assumption. It requires one thing: the P/OCF multiple reverting toward its own ten-year median of 15.01x as the capex cycle peaks and FCF conversion begins to recover.
At 2.56 billion diluted shares, $720 per share implies a market cap of $1.843 trillion. Against $125 billion in LTM OCF, that is a P/OCF of 14.74x, still below the ten-year median. At $760 per share, the implied market cap is $1.946 trillion, a P/OCF of 15.57x, just modestly above the median. The midpoint of the fair value range sits almost exactly at the ten-year median multiple on current trailing cash flows.
That is the entire argument.
A 33%-growing business with 41% operating margins and $81 billion in cash on the balance sheet, simply trading at its own historical average P/OCF multiple, is worth $720 to $760 per share. Just mean reversion on a metric where the business is operationally stronger today than at any prior point in that mean’s construction.
The EV/EBIT chart reinforces this. At 17.08x against an 18.43x median, even the earnings metric most distorted by the depreciation cycle is only modestly below historical norms. The franchise is not impaired. The optics are temporarily distorted by the accounting treatment of a one-cycle infrastructure build.
The bottom line
EV/EBIT tells you reported profitability is temporarily suppressed by depreciation on an unprecedented capex build, not by deterioration in the underlying business. P/OCF tells you operational cash generation is being discounted to levels not seen outside of the 2022 trough. FCF explains why: the market is rationally discounting OCF that cannot currently convert to distributable cash at historical rates.
The opportunity exists because the market is treating the capex cycle as permanent. The evidence suggests it is not. Revenue is growing at 33%. The advertising stack is compounding. The infrastructure being built today supports revenue that does not yet fully appear in the income statement. When capex intensity normalizes relative to that revenue base, the FCF conversion recovers, the P/OCF discount closes, and the stock re-rates toward fair value.
At $629.06 and 11.09x forward P/OCF, you are buying that normalization at a meaningful discount. The path to $720 to $760 runs through peak capex and into the recovery on the other side. For investors with the horizon and conviction to hold through that cycle, the risk-reward is as compelling as anything in large-cap technology right now.
See you next time!
And remember, great investments don’t shout. They compound quietly.

Note: I would love to hear from you!
If you want to share your thoughts or suggestions about FluentInQuality, or if there are any specific topics you’d like me to cover, just send an email to fluentinquality@gmail.com
Any other questions? Shoot me an email.
Don’t worry! I’ll never share your information.
Disclaimer
By having read this content, you acknowledge and accept the terms of the disclaimer that you can read here.