
How to Actually Read a 10-K (Without Losing Your Mind)
Here is a practical framework for extracting what actually matters, using O'Reilly Automotive's 2025 filing as a live example.

Every year, thousands of companies file a 10-K with the SEC.
Every year, most retail investors either ignore it entirely or open it, see 80 pages of dense legal text, and quietly close the tab.
That is a mistake. The 10-K is the single most information-rich document a public company produces.
It is audited, legally binding, and written under the threat of securities fraud charges, which makes it far more reliable than an earnings press release, a CEO interview, or an analyst note.
The problem is not that the 10-K is incomprehensible.
The problem is that nobody teaches you where to look. Most of the document is boilerplate. The signal is buried, but it is there. Once you understand the structure, a 10-K stops being intimidating and becomes one of the most useful tools in your investing process.
This is how to actually read one.
What is actually in here
A 10-K is divided into four parts, each with numbered items. You do not need to read all of them with equal attention.
Here is what each part contains and how much weight to give it.
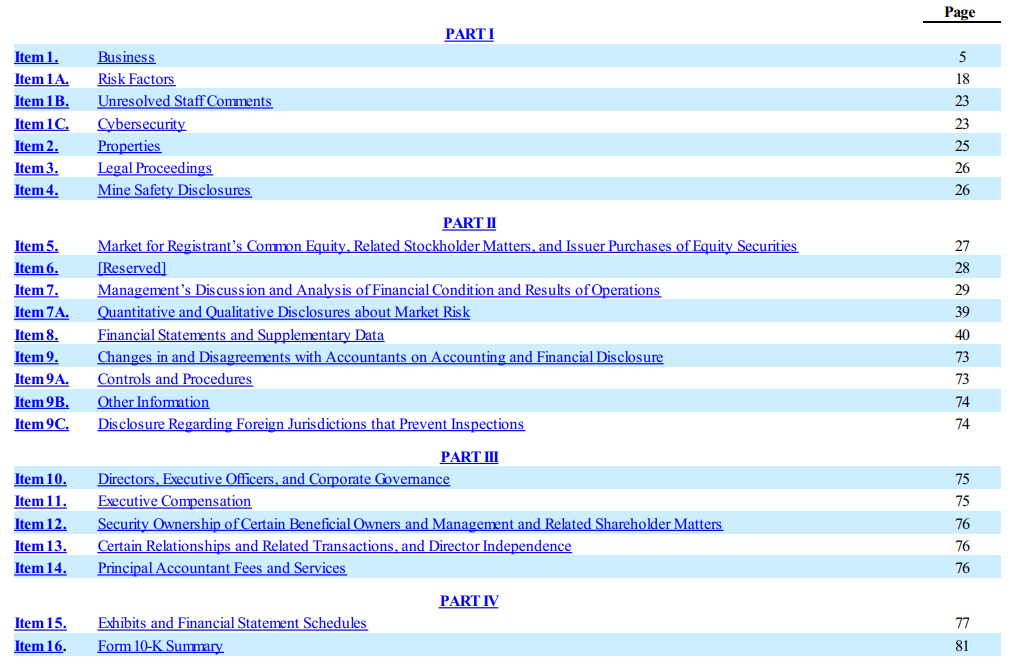
Part I covers the business description, risk factors, and properties. This is where management explains what the company does, how it competes, and what could go wrong. Read it carefully, especially the risk factors, which are often more honest than the rest of the document.
Part II contains the financial statements and management’s discussion of results. This is the engine of the filing. Spend the most time here.
Part III covers governance, executive compensation, and ownership. Useful for assessing management alignment, but often incorporated by reference from the proxy statement rather than written out in full.
Part IV is mostly a list of exhibits. Skip unless you need a specific legal document.
Step 1: Start with the business description, but read it skeptically
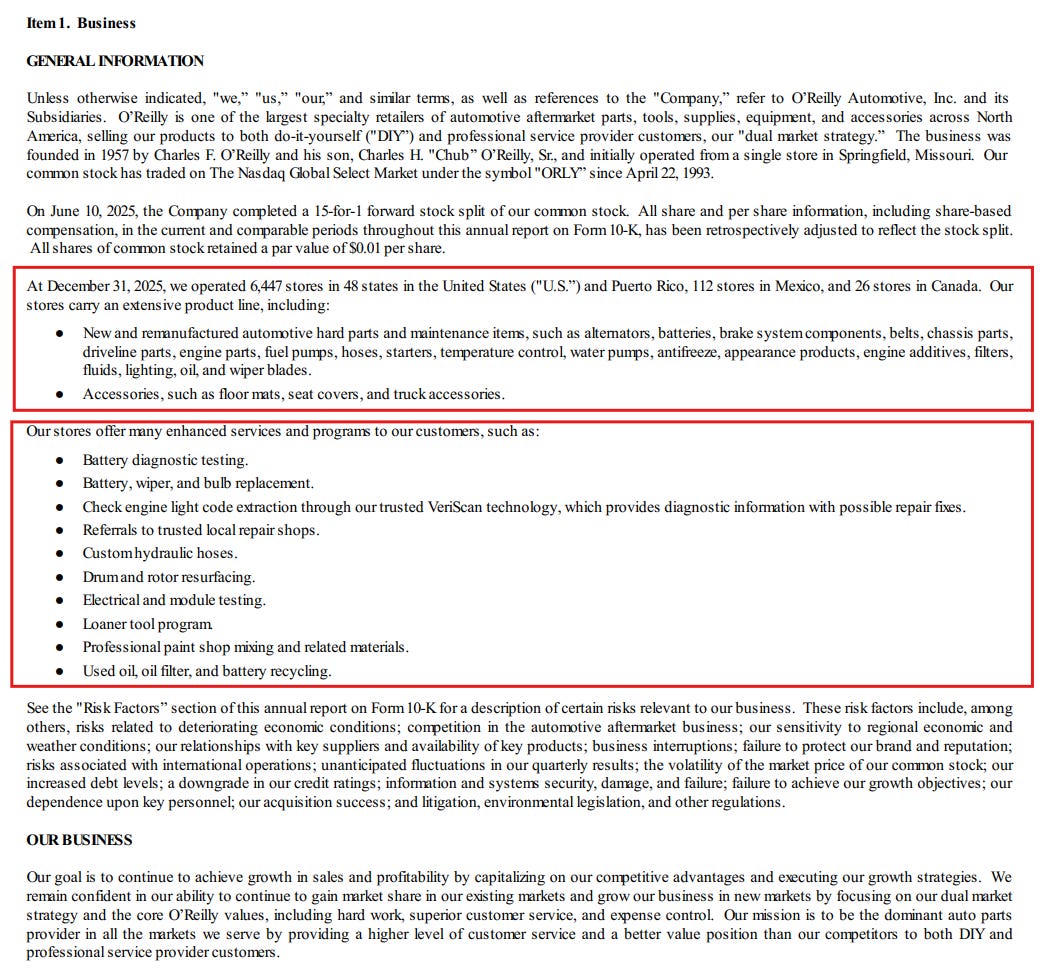
The business section (Item 1) is where management describes the company in the best possible light. Read it, but read it as marketing copy, not gospel. Your job is to extract the strategic facts while filtering out the promotional language.
With O’Reilly, the key facts from this section are immediately useful:
The company operates 6,585 stores across 48 U.S. states, Puerto Rico, Mexico, and Canada as of December 31, 2025
It serves two customer types, do-it-yourself consumers and professional service providers, through what it calls a “dual market strategy.”
The professional side now accounts for roughly 50% of sales, up from historically lower levels, and is growing faster than the DIY side due to industry fragmentation
That last point matters for your thesis. A business increasingly weighted toward professional customers has more predictable, recurring demand, mechanics need parts regardless of consumer confidence. It also means the competitive dynamics are different; professional customers care about speed of delivery and parts availability above price, which plays to O’Reilly’s distribution strength.
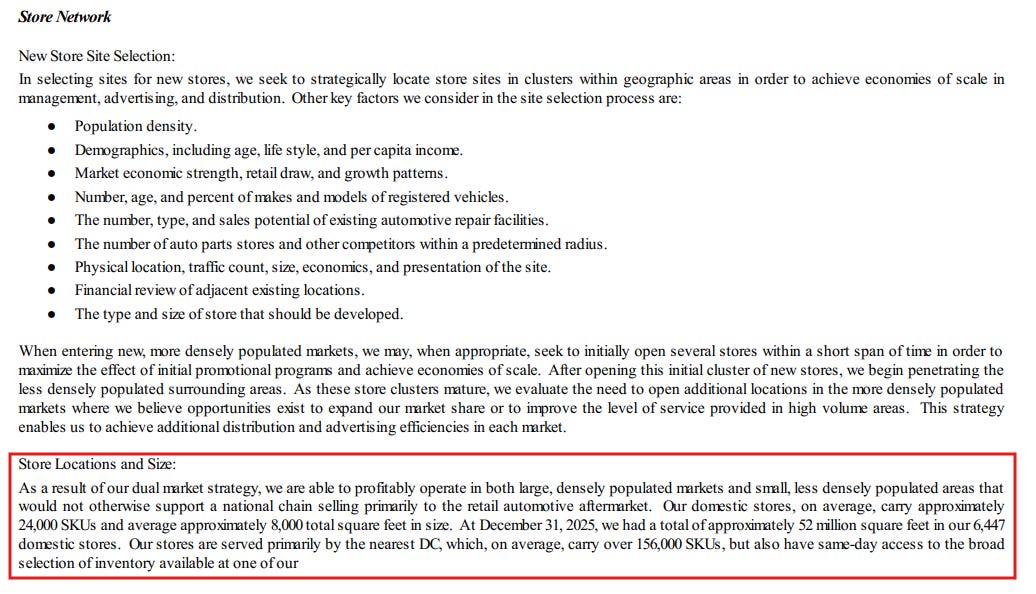
The section also describes 32 distribution centers providing same-day or overnight access to over 156,000 SKUs. That is not a detail to skim, it is the structural moat. No independent or regional competitor can replicate that network cheaply, and it is what keeps the professional service provider customer loyal.
Step 2: Read the risk factors for what management is actually worried about
Most investors skip the risk factors (Item 1A) because they assume it is just legal boilerplate designed to protect the company from lawsuits. That is partially true. But buried inside the boilerplate are genuine disclosures about what keeps management up at night.
With O’Reilly’s 2025 filing, two risks stand out as particularly worth noting.
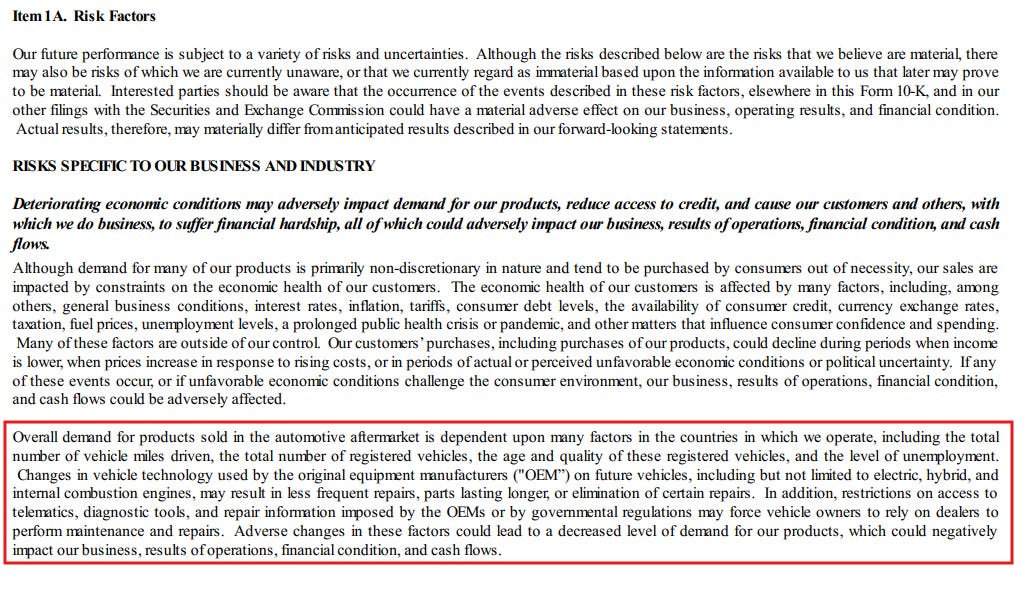
The EV and technology risk. The filing explicitly acknowledges that changes in vehicle technology, including electric and hybrid vehicles, “may result in less frequent repairs, parts lasting longer, or elimination of certain repairs.” This is the long-term structural question overhanging the entire auto parts sector. O’Reilly is not immune to it. The average vehicle age in the U.S. is 12.6 years as of 2024, which currently works in their favor, older vehicles need more maintenance. But the company itself is flagging the risk that this tailwind will reverse over time.
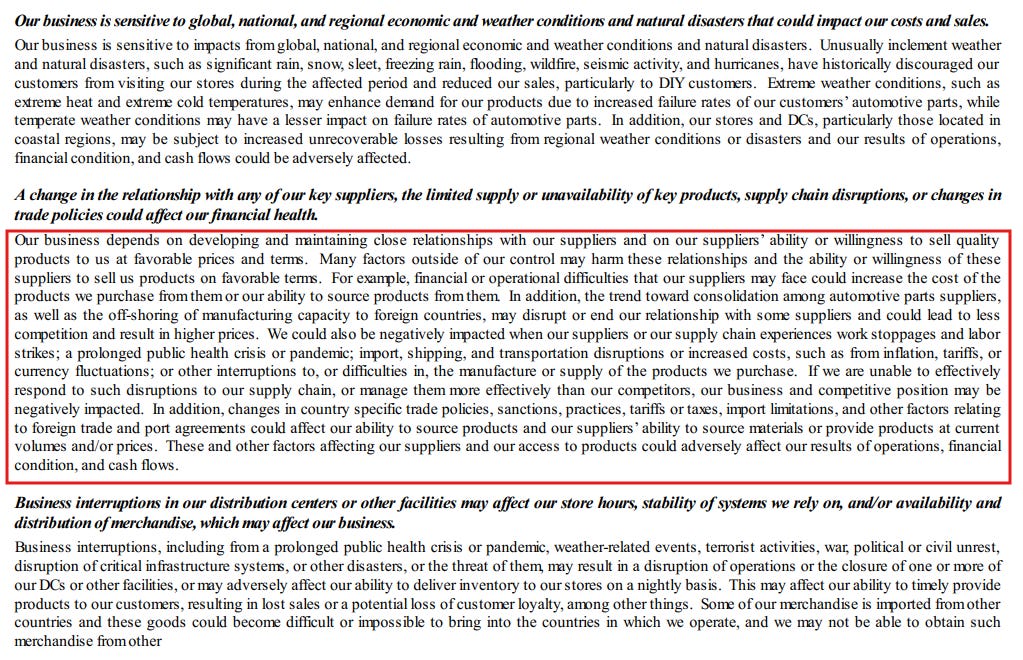
The tariff and supply chain risk. The 2025 filing mentions increased tariffs as a driver of higher acquisition costs, which were then passed on to customers through higher selling prices. This is worth tracking. The company successfully passed these costs through in 2025, contributing to higher average ticket values. Whether that remains possible in a more price-sensitive environment is an open question.
When you read risk factors, ask yourself two questions: which of these risks are generic to every company in any industry, and which are specific to this business model? The generic ones (cybersecurity, litigation, etc.) are largely boilerplate. The specific ones are where the analytical work begins.
Step 3: Management’s Discussion and Analysis, the most underrated section
Item 7, the MD&A, is where management explains the numbers in plain English. It sits between the risk factors and the raw financial statements, and it is the best place to understand why the numbers moved, not just by how much.
O’Reilly’s 2025 MD&A contains several passages worth examining closely.
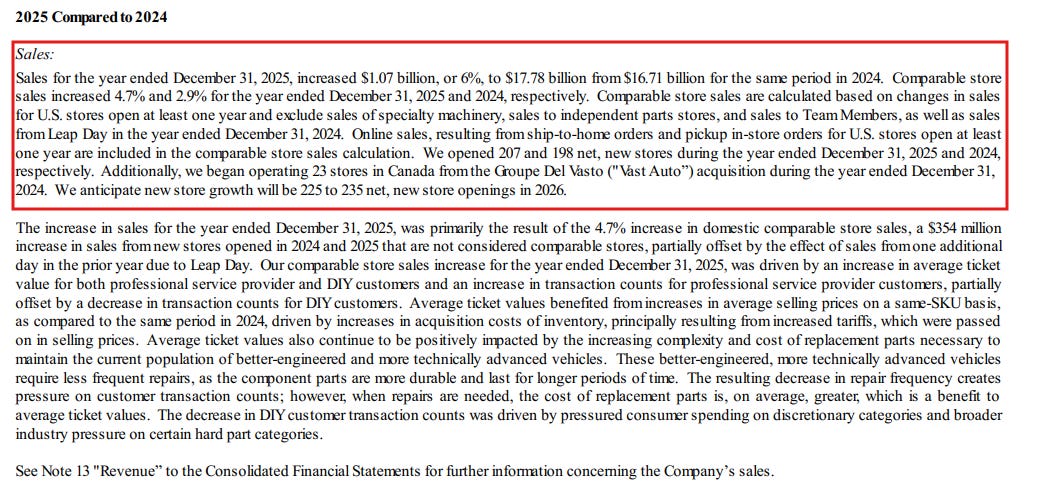
On revenue growth. Sales grew 6% to $17.78 billion in 2025, driven by a 4.7% comparable store sales increase. Management breaks down what drove that increase: higher average ticket values (due to more complex and expensive replacement parts on modern vehicles, plus tariff-driven price increases) and higher transaction counts from professional customers, partially offset by declining DIY transaction counts due to pressured consumer spending. That last sentence matters. The DIY customer is feeling squeezed. The professional customer is holding up. An investor tracking this company should watch the DIY/professional mix closely in future filings.
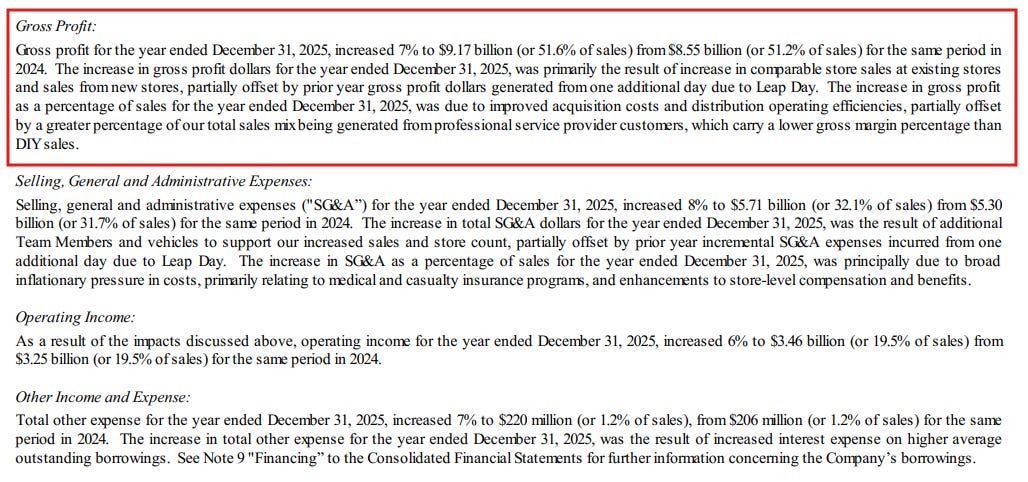
On margins. Gross margin expanded from 51.2% to 51.6%, driven by improved acquisition costs and distribution efficiency. SG&A as a percentage of sales ticked up from 31.7% to 32.1%, driven by medical and casualty insurance inflation and store-level compensation increases. Operating margin was flat at 19.5%. The margin story in 2025 is essentially: better sourcing economics offset by rising people costs. That is a healthy dynamic, but it signals that the company cannot rely on gross margin expansion forever.
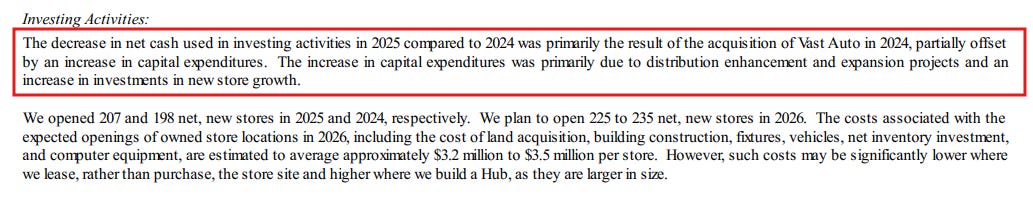
On capital expenditure. Capex increased to $1.17 billion in 2025 from $1.02 billion in 2024, driven by distribution center expansion and new store growth. Free cash flow came in at $1.56 billion, down from $1.99 billion the prior year, primarily because of the timing of renewable energy tax credit payments, not deteriorating operating performance. Context like this is exactly why the MD&A exists: the raw number looks worse, but the explanation reveals it is a timing issue.
Now getting into the most crucial parts of understanding the 10-K.
Want to learn how to evaluate the 10-K like a pro? Join the Fluent Few premium today.
Just €25/month or €275/year (save a full month) unlocks this + all future premium content: real buys/sells, detailed cases, portfolio updates, education, and more.
Upgrade now, don’t miss these edges.
P.S. If you’re on iOS or Android, subscribe via the website. App stores charge a 30% fee, which makes it more expensive for you. The website saves you real money.
If you’re on the fence about upgrading, shoot me a message. Let’s have a chat!