


The number is real, and it has been sitting in plain sight for decades.
Gotham Capital ran from 1985 to 1994 and compounded at roughly 50% a year before fees, about 34% after. Then Greenblatt gave the outside money back and kept managing his own. For years his publisher described Gotham as having produced something close to 40% annualized over the twenty years following its founding. The exact figure depends on which cut you use and whether you’re looking gross or net, and that distinction matters more than people admit, but the shape of it is not in dispute. It was one of the better ten-year records anyone has put up.
That’s the first 40%.
The second one is more interesting, because it isn’t a person. It’s a chart.
The chart that should have ended the argument
Greenblatt’s firm ran a study on the 2,000 largest US companies over a twenty-year stretch, 1992 to 2012.
Every single day, they ranked all 2,000 from cheapest to most expensive against their own estimate of what each business was worth. Then they asked a boring question: what did each group actually do over the following year?
The cheapest 1% of companies, so about twenty names at any given moment, averaged a one-year forward return of roughly 38%. The next percentile did about 37%. From there the line drops in a fairly orderly way, all the way down to the most expensive bucket, which did badly.
Greenblatt tells his Columbia students that if they can’t spot the trade on that chart, they should probably leave the room. Buy the top left. Short the bottom right. It really is that obvious.
So here’s the question worth sitting with. This research isn’t hidden. It’s been presented at conferences, printed in books, uploaded to YouTube, and taught to twenty-odd years of MBA students who went on to run actual money.
Why is the 38% still there?
The jelly bean jar
Greenblatt once tried to explain the market to a room full of orthopedic surgeons. Smart people, well educated, genuinely curious.
He talked for thirty-five minutes. Then the questions started, and they went something like: oil fell two dollars yesterday, what should I do? The market was up 2%, what does that mean for me? He walked out fairly sure he’d failed.
So when he was later asked to teach a ninth-grade class, mostly kids from Harlem, he tried something else. He brought in a jar of jelly beans.
He passed it around and asked everyone to write a private guess on an index card. Count the rows, do the math, whatever you like. Then he collected the cards and went around the room a second time, out loud, one student at a time, and each kid could keep their guess or change it after hearing the others.
The private guesses averaged 1,771.
The jar held 1,776.
The out-loud guesses averaged 850.
The first number is what happens when people do their own arithmetic. The second number is the market.
That’s the whole thesis in one jar. Prices are not the careful count. Prices are the second guess, the one made after you’ve read the paper, seen the headline, heard what the guy next to you thinks, and watched something go down 4% for reasons nobody can articulate. The careful count still exists. It just doesn’t set the price.
Which is inconvenient for the market and rather good news for you.
How he actually values a business
There’s no calculus here, and I say that as someone who went looking for it.
Greenblatt’s favorite explanation is a house. Somebody wants a million for it. Your job is to work out whether that’s fair. You’d ask two questions, in this order:
What could I rent it out for? If the thing throws off €80,000 a year, that’s an 8% yield on your million, and you can compare that to every other place you could park a million euros. This is absolute value. Does the cash it produces justify the price on its own terms?
What are the other houses going for? Same street, next neighborhood, next town. What did this house sell for historically compared to its neighbors, and how does that gap look today? This is relative value.
Businesses work identically. What does it earn on the capital invested in it, what am I paying for those earnings, and how does that stack up against every other business I could own instead, both today and against its own history.
Now the important bit, which most people skip.
Neither measure works alone. Relative cheapness on its own is how you ended up owning the cheapest internet stock in 1999, which was not cheap; it was merely the least insane thing in an insane neighborhood. Absolute cheapness on its own is how you end up owning something with a fat earnings yield and a business that’s quietly melting. The two measures exist to check each other. You want a company that looks cheap on its own numbers, cheap against its peers, and cheap relative to what it has historically been worth. When those three agree, you’re usually onto something.
That’s it. That’s the method. It fits on a napkin, which is precisely why it’s so hard to believe it works.
The part everybody skips
Here’s where the honest version of this article diverges from the version that would get more clicks.
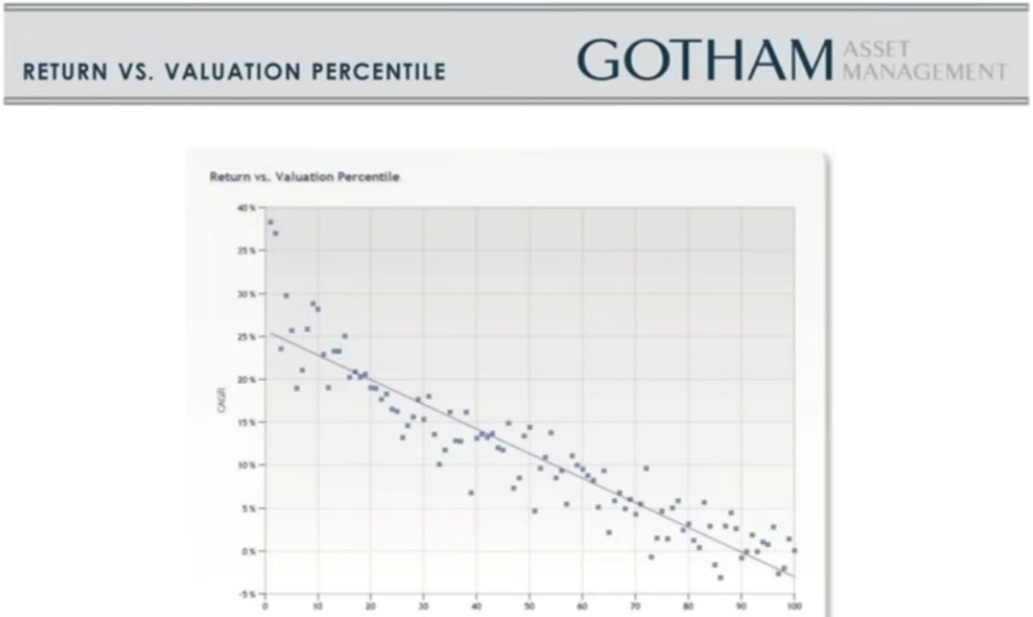
That beautiful chart, the one with the 38% in the corner and the tidy downward slope? Greenblatt is the first to say it looks nothing like that while you’re living inside it. Twenty years of data smooths into a clean line. Any three or four years of it is a mess. The fit degrades badly. Some years the cheap stuff gets cheaper and the expensive stuff runs away from you, and you sit there wondering whether the world changed or whether you did.
His Magic Formula backtest has the same fingerprint. Roughly 30% a year from 1988 to 2004 against about 12% for the S&P 500. And underneath that headline:
It underperformed in five months out of every twelve, on average.
It failed to beat the market in roughly one year out of four.
It went through stretches of three consecutive losing years against the index.
Read that list again, but this time imagine it’s your money and your third bad year in a row and your spouse has started asking questions.
What happened when real people tried it
This is the study that changed how I think about my own process, and it’s the reason I’m writing this piece the way I am.
Greenblatt’s firm launched managed accounts that ran the formula. Clients could pick one of two options. Self-managed, where you choose which names off the pre-approved list to own and when to trade them. Or professionally managed, where the system just runs and nobody’s opinion touches it.
Over the first two years:
Self-managed accounts returned 59.4%
The S&P 500 returned 62.7%
Professionally managed accounts returned 84.1%
The humans took a market-beating system, applied their judgment to it, and turned a 21-point win into a 3-point loss. Same list. Same rules. Same starting point.
Greenblatt dug into what they’d actually done, and the failure modes are almost comically predictable. They skipped the stocks that looked scariest, which turned out to be many of the biggest winners, because the reason a stock is cheap is usually well known and well publicised and sitting right there in the headlines. They stopped rebalancing when the strategy went cold. They added money after good stretches and pulled it after bad ones.
If you want the same lesson at industrial scale, look at CGM Focus. Best-performing US stock fund of the 2000s, about 18% a year through a decade when the index went roughly nowhere. According to Morningstar’s dollar-weighted numbers, the average investor in that fund lost about 11% a year. The fund was up 80% in 2007, money flooded in, it fell 48% in 2008, money fled, and it recovered in 2009 without them.
The manager’s own comment on it was that a huge amount of money arrived exactly at the peak and there was nothing he could do about it.
Why the edge doesn’t get arbitraged away
Greenblatt has a clean way of explaining this, and once you hear it you can’t unhear it.
Say gold trades at $1,200 in New York and $1,201 in London at the same moment. Some algorithm closes that gap before you’ve finished reading this sentence. Buy the cheap one, sell the expensive one, collect, done. That’s arbitrage, and it doesn’t survive contact with modern markets.
Now change the terms slightly. Gold is $1,200 in New York today. Sometime in the next two or three years you will make money on it. Along the way you might be down 20%, and you will have no idea when the gap closes.
There is nobody on any trading desk anywhere who can hold that position.
Not because they don’t see it. Because they’ll be fired in month fourteen. That’s the whole edge, and it’s structural rather than intellectual. Everybody with a boss, a quarterly report card, or a redemption window is playing a shorter game than the game the opportunity requires. Time horizons keep shrinking too. Greenblatt points out that he used to get quarterly statements, and most people binned them. Now you can check a price thirty times a minute, and plenty of people do.
So the trade isn’t information. It’s patience, which happens to be the one input that can’t be scaled, automated, or bought.
What to actually do with this
Six things, in descending order of how much they’ll change your results.
Write your valuation down before you buy. Not a target price, the actual reasoning. What it earns, what you’re paying, why it’s cheap against peers and against its own history. If you can’t write it in five sentences, you don’t have it yet. This is also the only defence you’ll have in month fourteen when the thing is down 20% and you can’t remember why you own it.
Pick your holding period before you pick the stock. Greenblatt asks for three to five years. If your honest answer is eighteen months, you are not running this strategy, you’re running a different one and calling it this one.
Separate the decision from the outcome. A stock going down doesn’t mean you were wrong. It means the second guess moved. The only thing that should change your mind is new information about the business, and a falling price is not information about a business.
Count your rows before you hear anyone else’s number. Do the work, form the estimate, write it down. Then read the bear case. Doing it in that order is the difference between 1,771 and 850, and it costs you nothing except the discomfort of committing to a view.
Be suspicious of your own improvements. The self-managed accounts didn’t blow up on some exotic error. They just skipped the uncomfortable names. If you find yourself passing on something that clears your process because it feels wrong, write down why. Check that note in a year. You’ll learn more about yourself from that file than from any backtest.
Own enough of them. The cheapest bucket averaged 38%. The average is doing serious work in that sentence. Any individual name in it can and will be a disaster.
The honest scoreboard
Nobody should read this and expect 40% a year, and I’d rather say that plainly than let the headline do something dishonest on my behalf.
The 38% belongs to the top percentile of a twenty-year backtest, before costs, before taxes, before the several occasions on which you would have panicked. Greenblatt’s own 50% came from a concentrated, leverage-capable special-situations book running in the 1980s and 1990s with a fraction of today’s competition. His public funds have had a considerably more human time of it since.
What the chart actually tells you is direction, and direction is enough. Cheap and good has beaten expensive and bad by a wide, persistent, embarrassingly well-documented margin across markets and decades. The edge is real. The tax you pay to collect it is discomfort, denominated in years.
Greenblatt makes his students a promise on the first day of every class. If you do good valuation work, the market will eventually agree with you.
He just refuses to say when.
See you next time!
And remember, great investments don’t shout. They compound quietly.
—Yorrin
Note: I would love to hear from you!
If you want to share your thoughts or suggestions about FluentInQuality, or if there are any specific topics you’d like me to cover, just send an email to fluentinquality@gmail.com
Any other questions? Shoot me an email.
Don’t worry! I’ll never share your information.
Disclaimer
By having read this content, you acknowledge and accept the terms of the disclaimer that you can read here.
This sounds very similar to a method a friend of mine once used. He was not a financial genius, but was technically trained in stats. He said if you look at the market, any stock does up, moves sideways, or goes down. So he simply took the holdings of an index, ranked them by size and then matched the analyst projections of upside and downside for each. He then sorted them into quartile. He shorted the lowest quartile, sold covered calls on the next, and then ran we now call a concentrated portfolio on the other two. He did this once a year in December. As he said, “it’s just math”.
Doesn’t Gotham offer its own index funds now that somewhat replicate these strategies, and have each underperformed the market?
It should be mentioned in the article that in the years following the publishing of “The Little Book That Beats The Market”, the Magic Formula hasn’t worked nearly as well as it used to.